> Documentation index: https://firebase.google.com/docs/firestore/llms.txt
This page describes how to use Key Visualizer to check for performance issues
that are related to your Cloud Firestore usage patterns.
## Before you begin
To use Key Visualizer for Cloud Firestore, you must enable the
Firestore Key Visualizer API.
**Roles required to enable APIs**
To enable APIs, you need the `serviceusage.services.enable` permission. If you
created the project, then you likely already have this permission through the
Owner role (`roles/owner`). Otherwise, you can get this permission through the
Service Usage Admin role (`roles/serviceusage.serviceUsageAdmin`).
[Learn how to grant roles](https://firebase.google.com/iam/docs/granting-changing-revoking-access).
[Enable the API](https://console.cloud.google.com/apis/enableflow?apiid=firestorekeyvisualizer.googleapis.com&redirect=https://console.cloud.google.com)
### Required roles
Make sure that your account is granted one of the following IAM
roles:
- Cloud Datastore Owner
- Cloud Datastore Key Visualizer Viewer
- Editor
- Owner
These roles include the following IAM permissions which are
required to access Key Visualizer:
- `datastore.keyVisualizerScans.get`
- `datastore.keyVisualizerScans.list`
- `datastore.databases.getMetadata`
- `resourcemanager.projects.get`
You can also define a [custom role](https://docs.cloud.google.com/iam/docs/creating-custom-roles)
with the required permissions.
## Viewing a scan for a time period
Each Key Visualizer scan covers a two hour period. A scan for a given period
is available for databases with traffic that exceeds 3000 document operations
in any given minute in that period.
To launch Key Visualizer:
1. In the Google Cloud console, go to the **Databases** page.
[Go to Databases](https://console.cloud.google.com/firestore/databases)
2. Select the required database from the list of databases.
3. In the navigation menu, click **Key Visualizer**.
4. Select a time span and a metric from the available Key Visualizer scans:
1. Click the **Pencil icon** in the upper right. Select a **Date**
and a **Time Span**.
Scans are available based on [scan eligibility](https://firebase.google.com/docs/firestore/key-visualizer/key-visualizer.md.txt#scan_eligibility).
You can't select time spans that did not meet scan eligibility or that are
still processing. The two most recent scans of the day will take some
time to process before they are available.
2. Select **All document data** or **All index data** as the source.
3. Click **Update**.
5. Select a metric to analyze:
Click the metrics dropdown in the upper left and select a metric to view. Key
Visualizer opens in the **Ops/s** metric for document keys and **Index
Write Ops/s** metric for index keys by default.
To compare metrics or look for data correlations, you can display
multiple Key Visualizer metrics together.
See [Finding connections between different metrics](https://firebase.google.com/docs/firestore/key-visualizer/keyvis-exploring-heatmaps.md.txt#finding-connections).
## Viewing an activity overview
To get an overview of activity during the selected two-hour time period,
review the heatmap for the default metric.
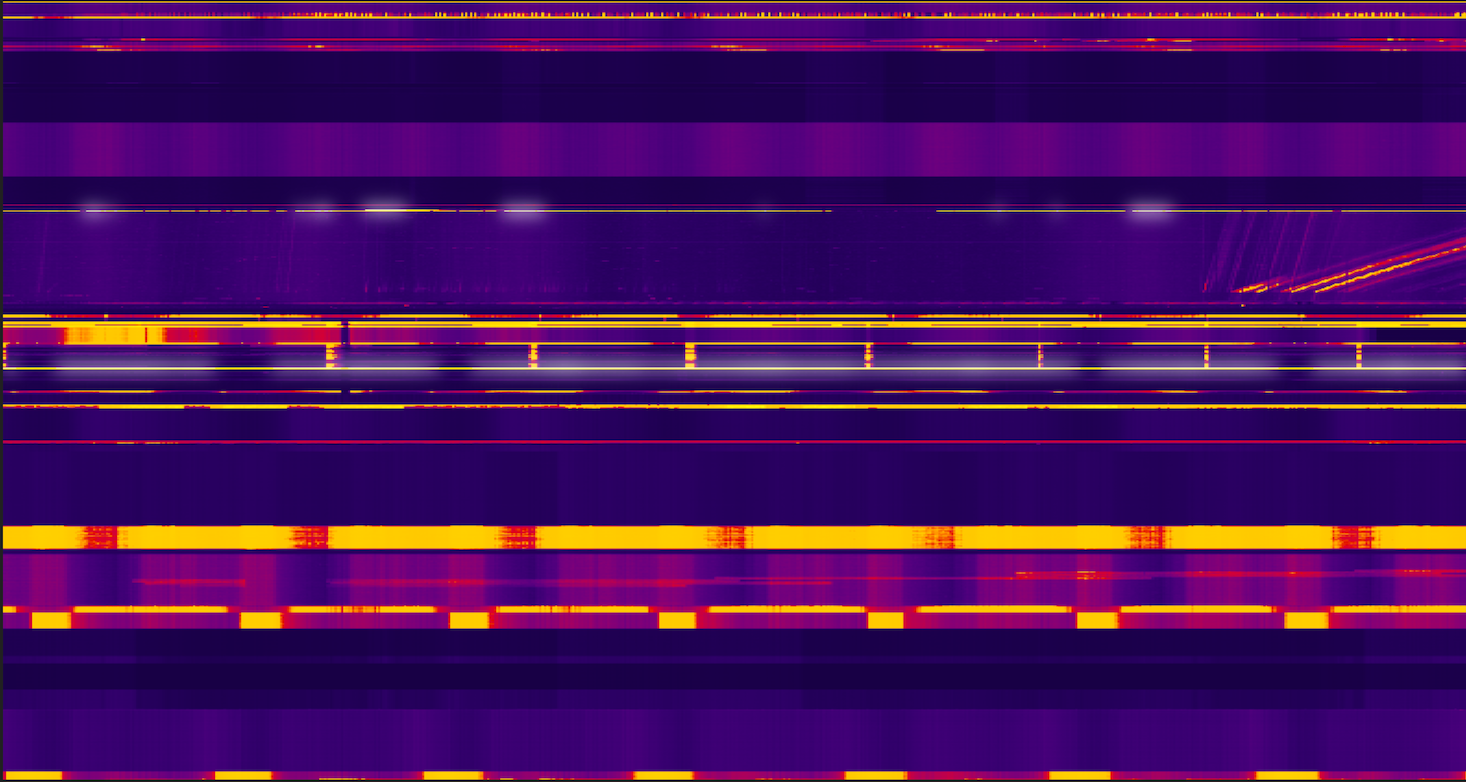
The following example shows a heatmap where there are major differences in the
usage pattern for different key ranges:
- Ranges shown in dark colors have little or no activity.
- Ranges in bright colors have significantly more activity.
- The glowing white range in the middle has very high activity.
### Document keys scan
The **Ops/s** metric measures the number of requests per second for each key
range. This metric is a sum of write, lookup, and query requests. Key Visualizer
shows this metric by default when you open a heatmap.
After getting an idea of the overall activity in your database,
you can continue your investigation by looking at other metrics and
focusing on key ranges that might be causing problems. [Learn
more](https://firebase.google.com/docs/firestore/key-visualizer/keyvis-exploring-heatmaps).
### Index keys scan
The **Index Write Ops/s** metric at a given cell measures the average index writes per second
within the corresponding 10-second time interval and key range.
## What's next
- Learn to recognize [common patterns in heatmaps for document keys](https://firebase.google.com/docs/firestore/key-visualizer/keyvis-patterns.md.txt).
- Learn to recognize [common patterns in heatmaps for index keys](https://firebase.google.com/docs/firestore/key-visualizer/keyvis-patterns-index.md.txt).
- Find out how to [explore a heatmap in depth](https://firebase.google.com/docs/firestore/key-visualizer/keyvis-exploring-heatmaps.md.txt).