
Performance Monitoring uses traces to collect data about monitored processes in your app. A trace is a report that contains data captured between two points in time in your app.
For Apple and Android apps, Performance Monitoring automatically collects several traces related to app lifecycle. All these traces are like timers because they measure the time it takes for the process to run (the "duration").
App start trace — A trace that measures the time between when the user opens the app and when the app is responsive
App-in-foreground trace — A trace that measures the time when the app is running in the foreground and available to the user
App-in-background trace — A trace that measures the time when the app is running in the background
Since these traces only collect the metric "duration", they are sometimes called "Duration traces".
You can view data from these traces in the Custom traces subtab of the traces table, which is at the bottom of the Performance dashboard (learn more about using the console later on this page).
Definitions for each trace
Performance Monitoring uses method calls and notifications in your app to determine when each type of trace starts and stops. All these traces are like timers because they measure the time it takes for the process to run.
App start trace
This trace measures the time between when the user opens the app and when the
app is responsive. In the console, the trace's name is _app_start. The
collected metric for this trace is "duration".
Starts when the application loads the first
Objectto memory.Stops after the first successful run loop that occurs after the application receives the
UIApplicationDidBecomeActiveNotificationnotification.
App-in-foreground trace
This trace measures the time when the app is running in the foreground and
available to the user. In the console, the trace's name is _app_in_foreground.
The collected metric for this trace is "duration".
Starts when the application receives the
UIApplicationDidBecomeActiveNotificationnotification.Stops when it receives the
UIApplicationWillResignActiveNotificationnotification.
App-in-background trace
This trace measures the time when the app is running in the background. In the
console, the trace's name is _app_in_background. The reported metric for this
trace is "duration".
Starts when the application receives the
UIApplicationWillResignActiveNotificationnotification.Stops when it receives the
UIApplicationDidBecomeActiveNotificationnotification.
Metrics collected by these traces
These traces are out-of-the-box traces, so you cannot add custom metrics or custom attributes to them.
All these traces are like timers because they measure the time it takes for the monitored process to run. The name of this collected metric is called "duration".
Track, view, and filter performance data
To view real-time performance data, make sure that your app uses a Performance Monitoring SDK version that's compatible with real-time data processing. Learn more about real-time performance data.
Track key metrics in your dashboard
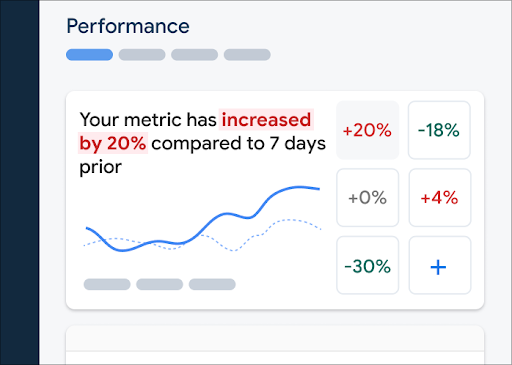
To learn how your key metrics are trending, add them to your metrics board at the top of the Performance dashboard. You can quickly identify regressions by seeing week-over-week changes or verify that recent changes in your code are improving performance.
To add a metric to your metrics board, follow these steps:
- Go to the Performance dashboardin the Firebase console.
- Click an empty metric card, then select an existing metric to add to your board.
- Click on a populated metric card for more options, for example to replace or remove a metric.
The metrics board shows collected metric data over time, both in graphical form and as a numerical percentage change.
Learn more about using the dashboard.
View traces and their data
To view your traces, go to the Performance dashboard in the Firebase console, scroll down to the traces table, then click the appropriate subtab. The table displays some top metrics for each trace, and you can even sort the list by the percentage change for a specific metric.
Performance Monitoring provides a troubleshooting page in the Firebase console that highlights metric changes, making it easy to quickly address and minimize the impact of performance issues on your apps and users. You can use the troubleshooting page when you learn about potential performance issues, for example, in the following scenarios:
- You select relevant metrics on the dashboard and you notice a big delta.
- In the traces table you sort to display the largest deltas at the top, and you see a significant percentage change.
- You receive an email alert notifying you of a performance issue.
You can access the troubleshooting page in the following ways:
- On the metric dashboard, click the View metric details button.
- On any metric card, select
=> View details . The troubleshooting page displays information about the metric you selected. - In the traces table, click a trace name or any metric value in the row associated with that trace.
- In an email alert, click Investigate now.
When you click a trace name in the traces table, you can then drill down into metrics of
interest. Click the
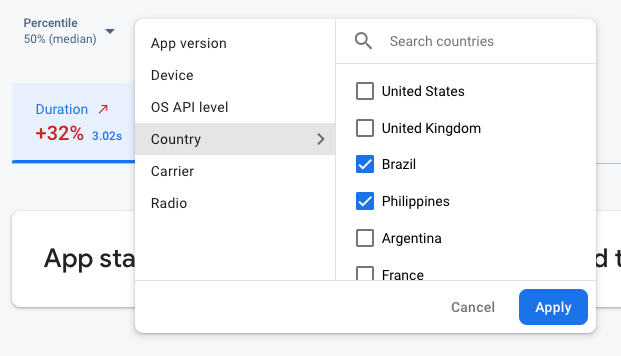
- Filter by App version to view data about a past release or your latest release
- Filter by Device to learn how older devices handle your app
- Filter by Country to make sure your database location isn't affecting a specific region
Learn more about viewing data for your traces.
Next Steps
Learn more about using attributes to examine performance data.
Learn more about how to track performance issues in the Firebase console.
Set up alerts for code changes that are degrading the performance of your app. For example, you can configure an email alert for your team if your app start time exceeds a threshold that you set.
- View detailed reports of user sessions in which you can see a specific trace in a timeline context of other traces collected during the same session.