
1. Overview
In this codelab, you'll learn how to monitor your app's performance during a feature rollout. Our sample app will have basic functionality, and it's set up to display a different background image based on a Firebase Remote Config flag. We'll go over instrumenting traces to monitor the app's performance, rolling out a configuration change to the app, monitoring the effect and seeing how we can improve the performance.
What you'll learn
- How to add Firebase Performance Monitoring to your mobile app to get out-of-the-box metrics (like app start time and slow or frozen frames)
- How to add custom traces to understand critical code paths of your user journeys
- How to use the Performance Monitoring dashboard to understand your metrics and track important changes like the rollout of a feature
- How to setup performance alerts to monitor your key metrics
- How to roll out a Firebase Remote Config change
Prerequisites
- Android Studio 4.0 or higher
- An Android emulator with API level 16 or higher.
- Java version 8 or higher
- A basic understanding of Firebase Remote Config
2. Set up the sample project
Download the code
Run the following command to clone the sample code for this codelab. This will create a folder called codelab-perf-rc-android on your machine:
$ git clone https://github.com/FirebaseExtended/codelab-feature-rollout-performance.git
If you don't have Git on your machine, you can also download the code directly from GitHub.
Import the project under the firebase-perf-rc-android-start folder into Android Studio. You will probably see some runtime exceptions or maybe a warning about a missing google-services.json file. We'll correct this in the next section.
In this codelab, you'll use the Firebase Assistant plugin to register your Android app with a Firebase project and add the necessary Firebase config files, plugins, and dependencies to your Android project — all from within Android Studio!
Connect your app to Firebase
- Go to Android Studio/Help > Check for updates to make sure that you're using the latest versions of Android Studio and the Firebase Assistant.
- Select Tools > Firebase to open the Assistant pane.
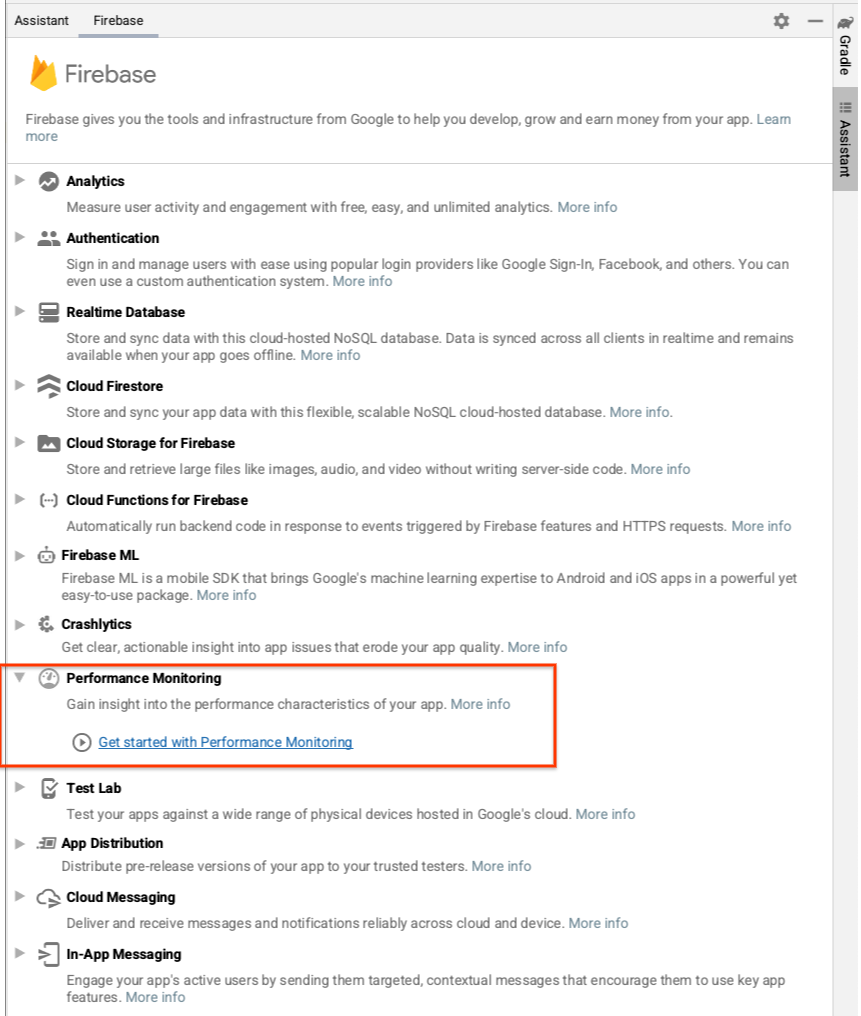
- Choose Performance Monitoring to add to your app, then click Get started with Performance Monitoring.
- Click Connect to Firebase to connect your Android project with Firebase. (This will open up the Firebase console in your browser.)
- Click the button to create a new project, and then enter a project name (for example,
Feature Rollout Performance Codelab). - Click Continue.
- If prompted, review and accept the Firebase terms, and then click Continue.
- (Optional) Enable AI assistance in the Firebase console (called "Gemini in Firebase").
- For this codelab, you do not need Google Analytics, so toggle off the Google Analytics option.
You can optionally enable Google Analytics because it will provide expanded Remote Config targeting options. However, this codelab uses a targeting option that does not require Google Analytics. - You should next see a dialog to Connect your new Firebase App to your Android Studio project.
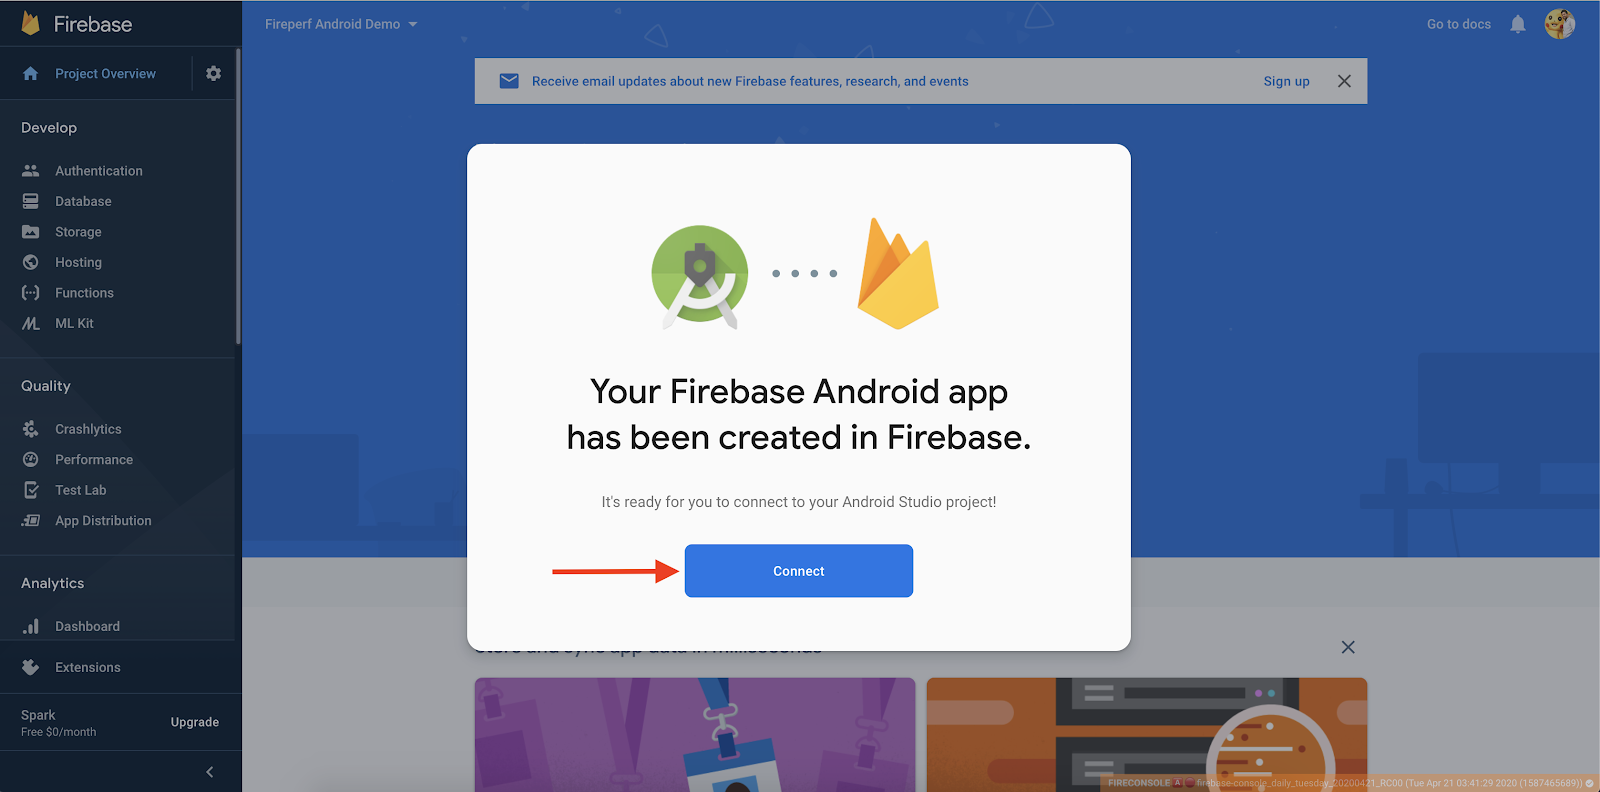
- Click Connect.
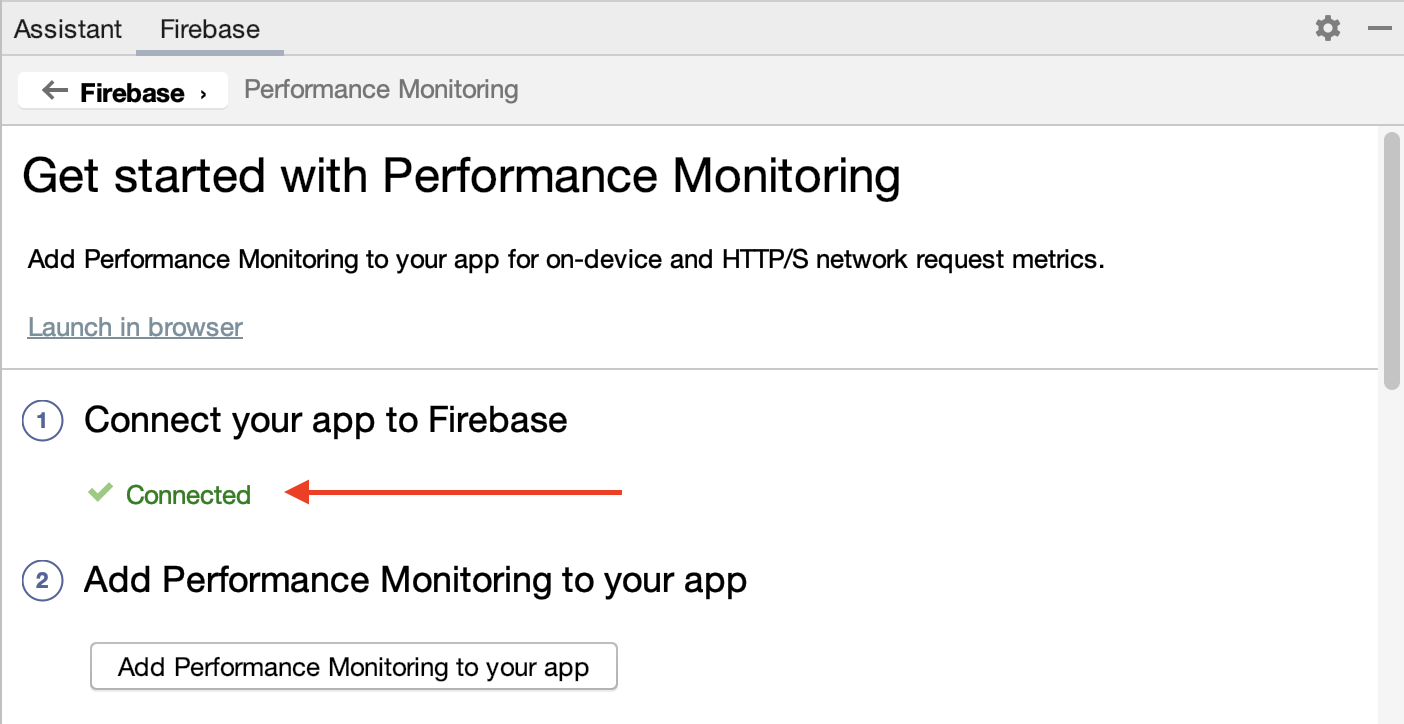
- Open Android Studio. In the Assistant pane, you will see the confirmation that your app is connected to Firebase.
Add Performance Monitoring to your app
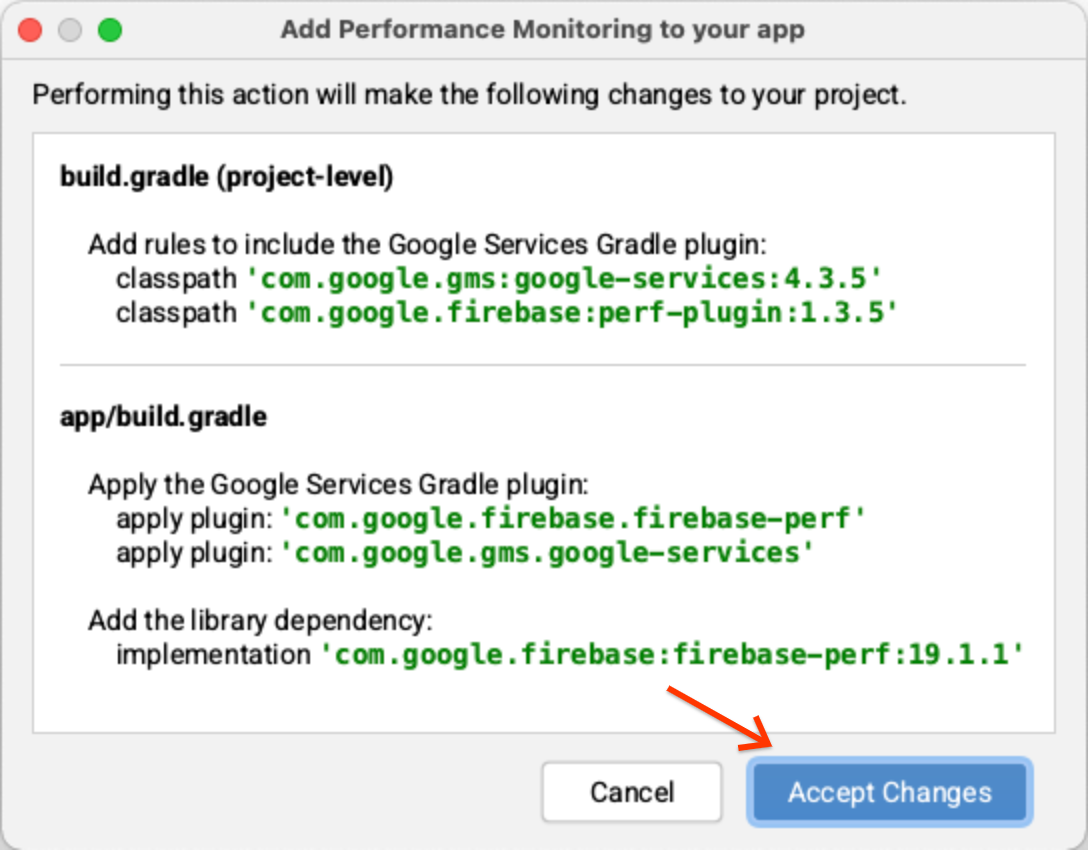
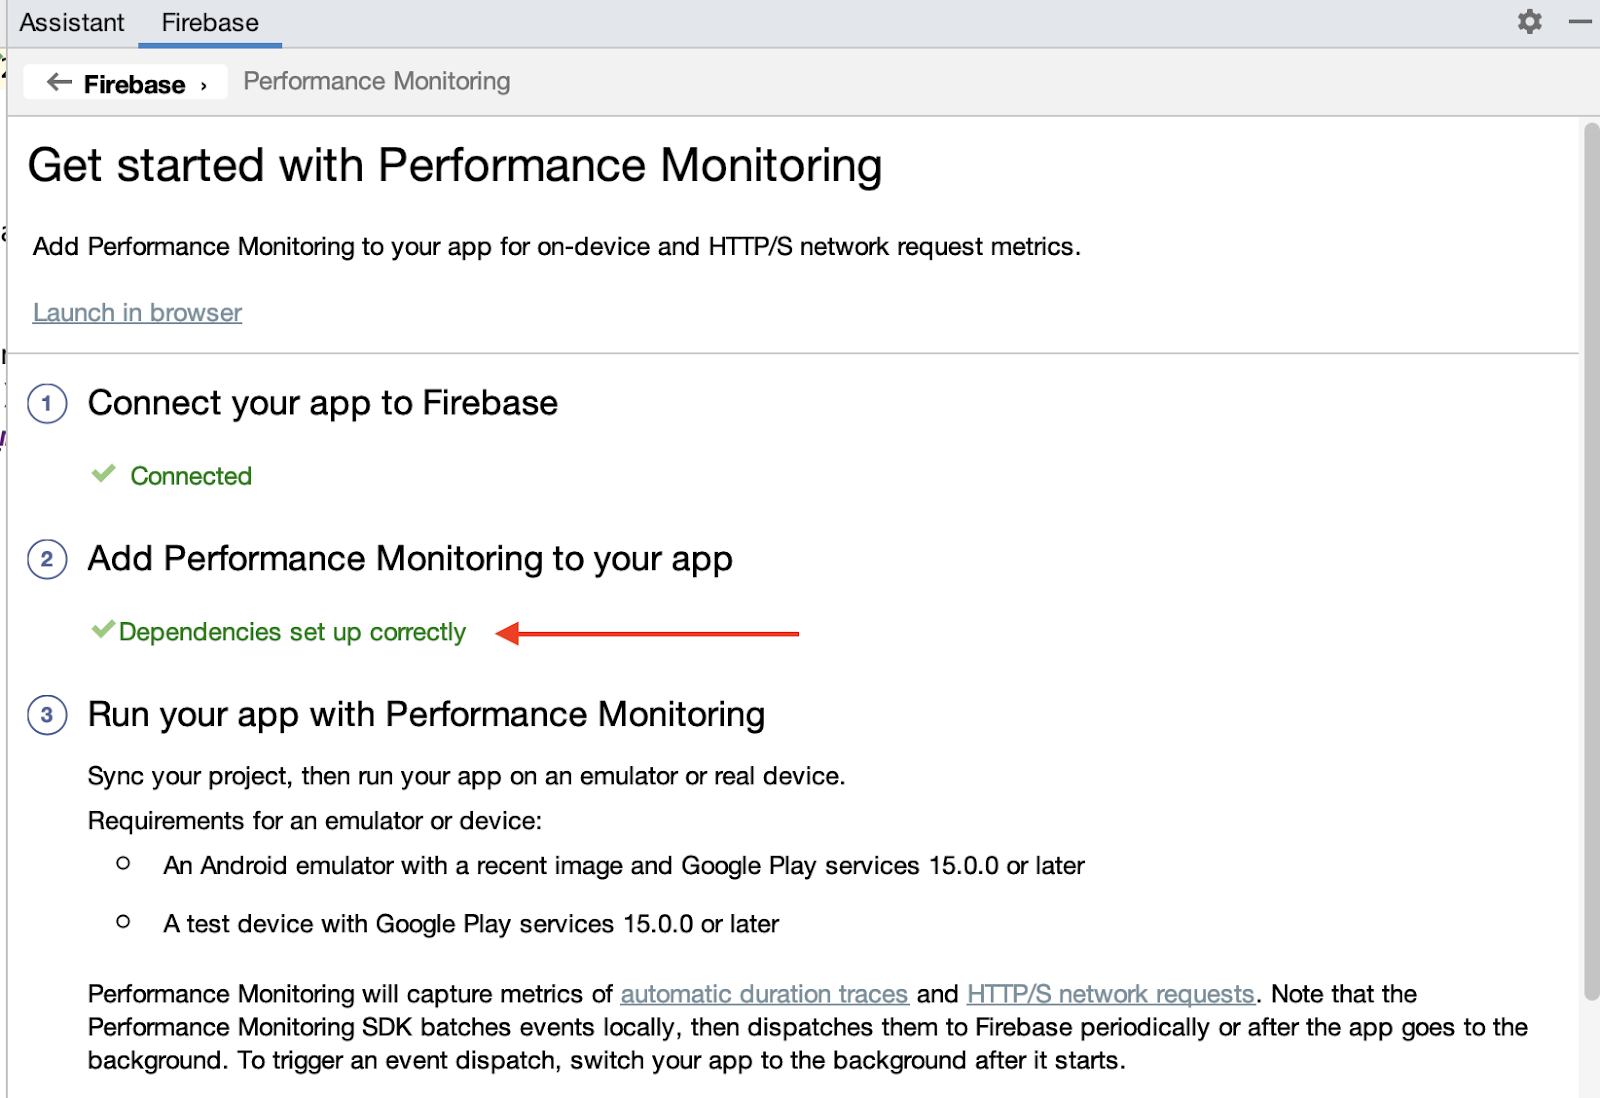
In the Assistant pane in Android Studio, click Add Performance Monitoring to your app.
You should see a dialog to Accept Changes after which Android Studio should sync your app to ensure that all necessary dependencies have been added.
Finally, you should see the success message in the Assistant pane in Android Studio that all dependencies are set up correctly.
As an additional step, enable debug logging by following the instructions in the step "(Optional) Enable debug logging". The same instructions are also available in the public documentation.
3. Run the app
You should now see google-services.json file in the module (app-level) directory of your app, and your app should now compile. In Android Studio, click Run > Run ‘app' to build and run the app on your Android emulator.
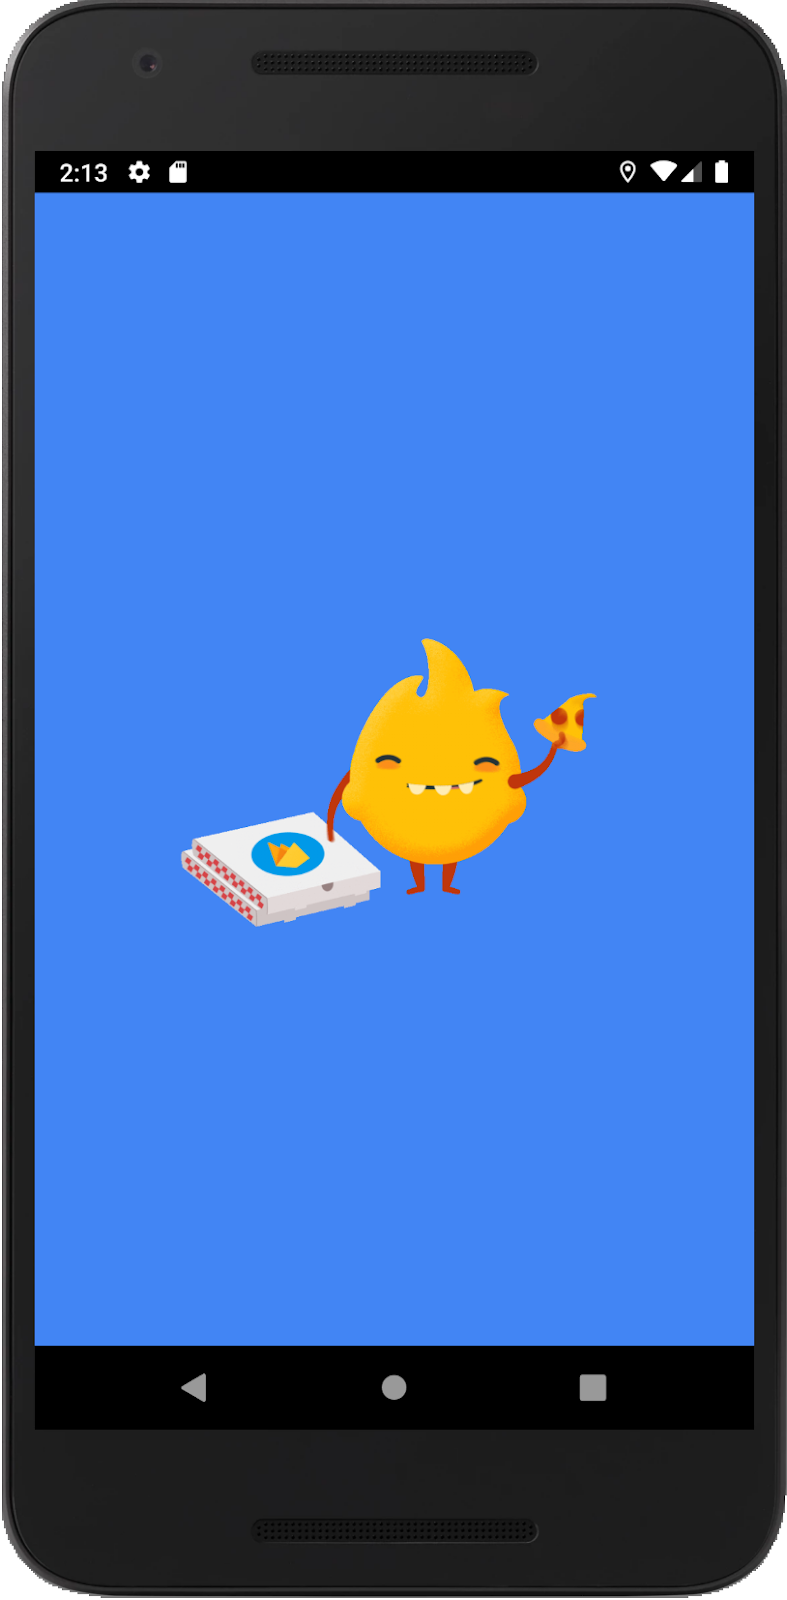
When the app is running, you should first see a splash screen like this:
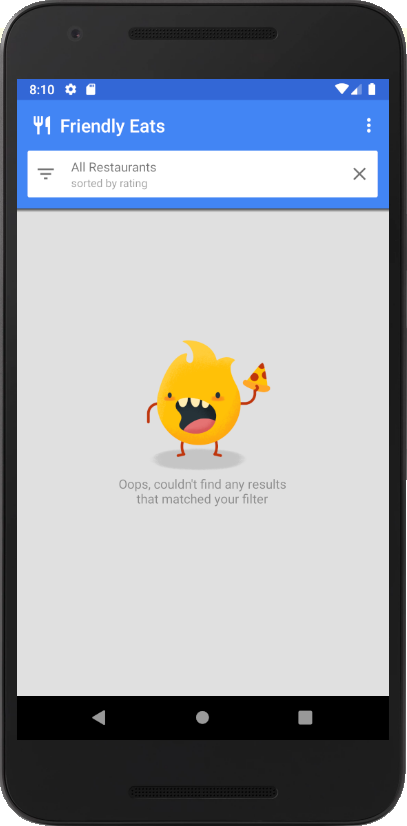
Then, after a few seconds, the main page with the default image will display:
What's happening under the hood?
The splash screen is implemented in SplashScreenActivity and does the following:
- In
onCreate(), we initialize Firebase Remote Config settings and fetch the config values that you'll set in the Remote Config dashboard later in this codelab. - In
executeTasksBasedOnRC(), we read the config value of theseasonal_image_urlflag. If a URL is provided by the config value, we download the image synchronously. - Once the download is complete, the app navigates to MainActivity and calls
finish()to endSplashScreenActivity.
In MainActivity, if seasonal_image_url is defined through Remote Config, the feature will be enabled and the downloaded image will be displayed as the background of the main page. Otherwise, the default image (shown above) will be displayed.
4. Set up Remote Config
Now that your app is running, you can set up the new feature flag.
- In the left panel of the Firebase console, locate the Engage section, then click Remote Config.
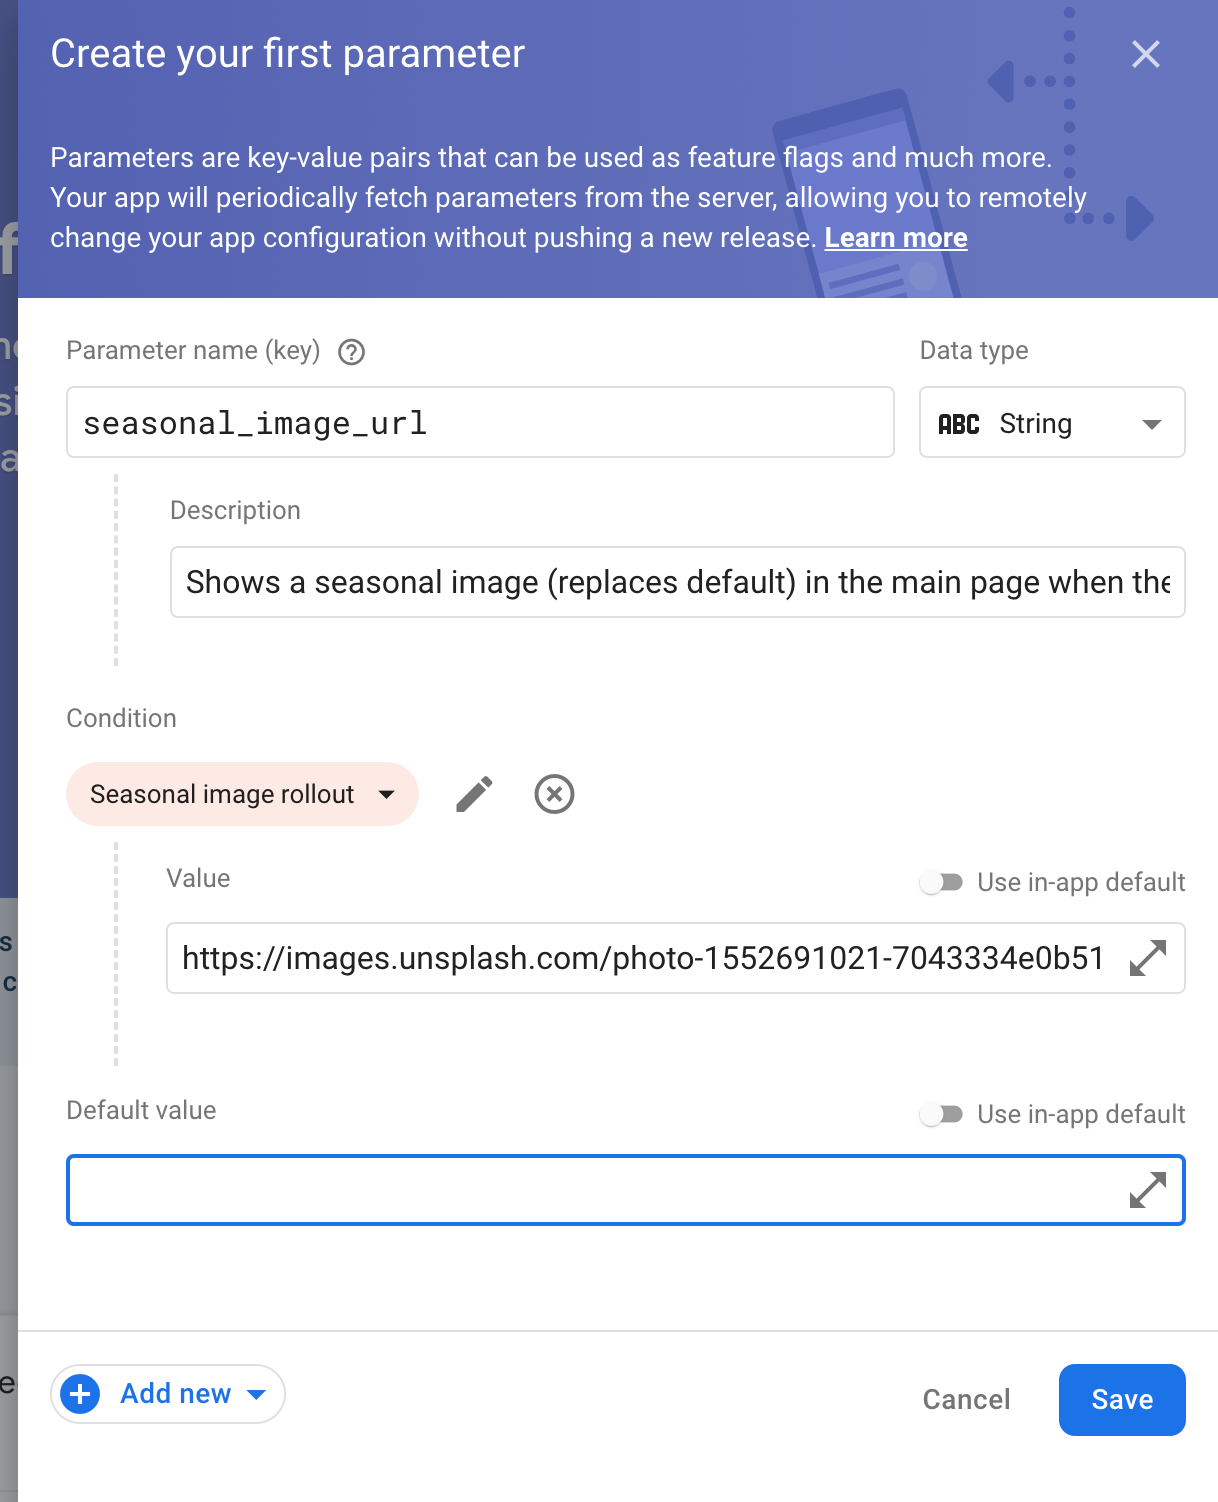
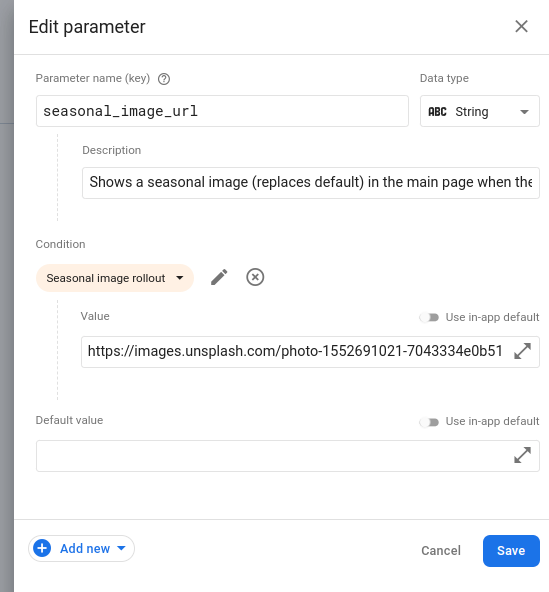
- Click the Create configuration button to open the configuration form and add
seasonal_image_urlas the parameter key. - Click Add description, then enter this description:
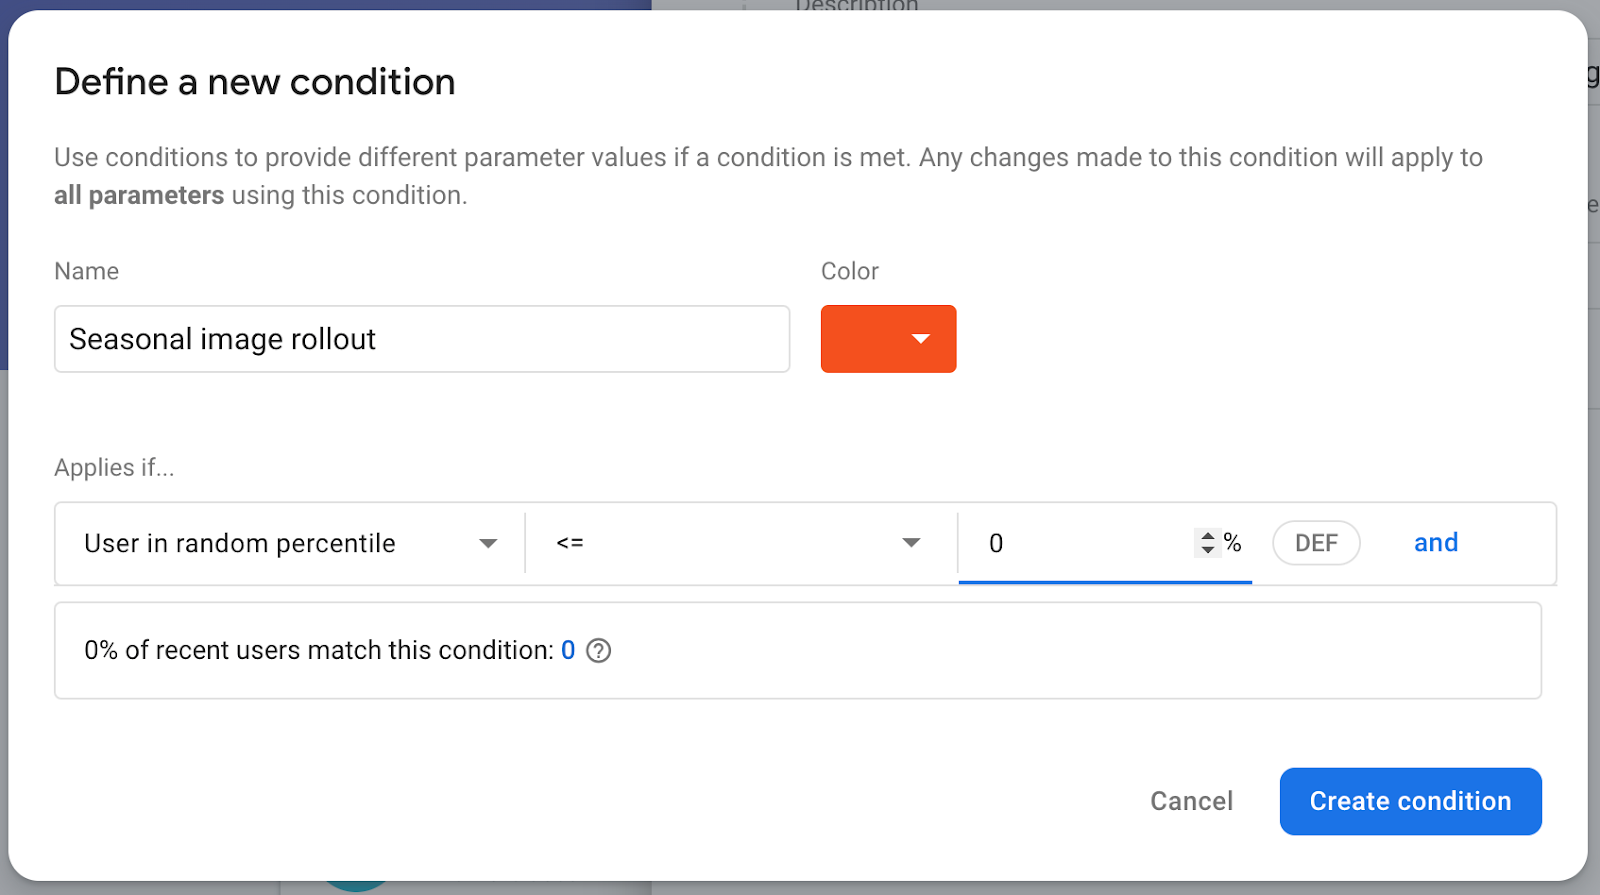
Shows a seasonal image (replaces default) in the main page when the restaurant list is empty. - Click Add new -> Conditional value -> Create new condition.
- For the condition name, enter
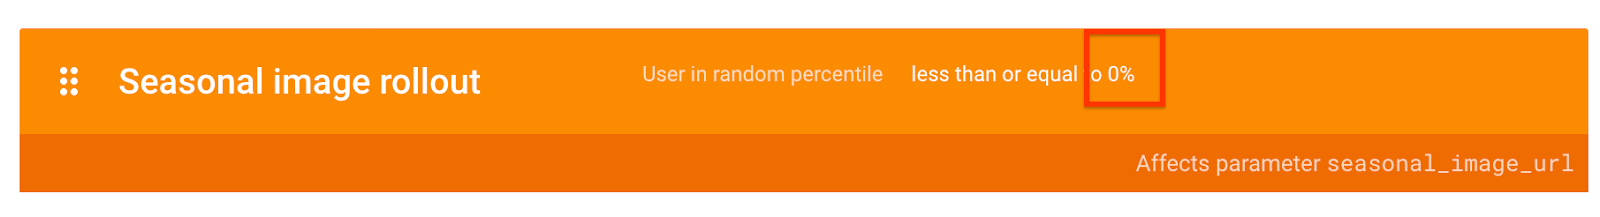
Seasonal image rollout. - For the
Applies if...section, selectUser in random percentile <= 0%. (You want to leave the feature disabled until you're ready to roll out in a later step.) - Click Create condition. You will use this condition later to roll out the new feature to your users.
- Open the Create your first parameter form and locate the Value for Seasonal image rollout field. Enter the URL where the seasonal image will be downloaded:
https://images.unsplash.com/photo-1552691021-7043334e0b51 - Leave the default value as an empty string. This means the default image in the codebase will be shown rather than an image downloaded from a URL.
- Click Save.
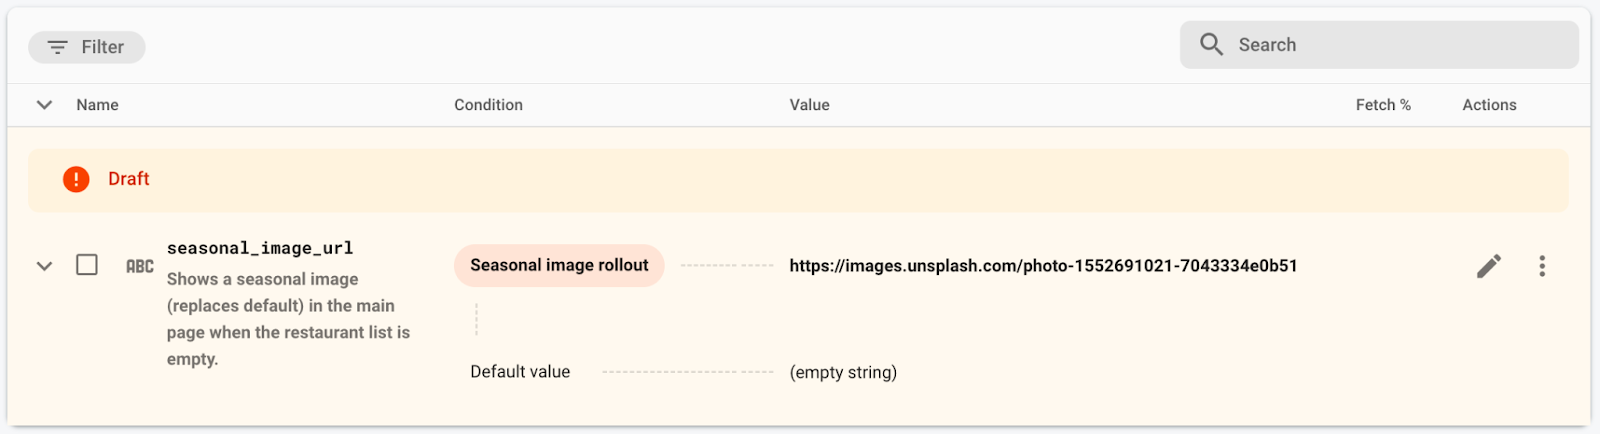
You can see that the new config is created as a draft.
- Click Publish changes and confirm the changes at the top to update your app.
5. Add monitoring for the data loading time
Your app pre-loads some data prior to showing MainActivity and displays a splash screen to hide this process. You don't want your users to wait too long on this screen, so normally it's beneficial to monitor how long the splash screen is displayed.
Firebase Performance Monitoring provides a way to do just that. You can instrument custom code traces to monitor the performance of specific code in your app – like the loading time for data and the processing time of your new feature.
To track how long the splash screen is displayed, you'll add a custom code trace to SplashScreenActivity, which is the Activity that implements the splash screen.
- Initialize, create, and start a custom code trace named
splash_screen_trace:
SplashScreenActivity.java
// ...
import com.google.firebase.perf.FirebasePerformance;
import com.google.firebase.perf.metrics.Trace;
// ...

public class SplashScreenActivity extends AppCompatActivity {

    private static final String TAG = "SplashScreenActivity";
    private static final String SEASONAL_IMAGE_URL_RC_FLAG = "seasonal_image_url";

    // TODO: Initialize splash_screen_trace
    private final Trace splashScreenTrace = FirebasePerformance.startTrace("splash_screen_trace");

    // ...
}
- End the trace in the
onDestroy()method ofSplashScreenActivity:
SplashScreenActivity.java
@Override
protected void onDestroy() {
    super.onDestroy();

    // TODO: Stop the splash_screen_trace here
    splashScreenTrace.stop();
}
Since your new feature downloads and processes an image, you'll add a second custom code trace that will track the additional time your feature has added to SplashScreenActivity.
- Initialize, create, and start a custom code trace named
splash_seasonal_image_processing:
SplashScreenActivity.java
private void executeTasksBasedOnRC(FirebaseRemoteConfig rcConfig) {
    String seasonalImageUrl = rcConfig.getString(SEASONAL_IMAGE_URL_RC_FLAG);
    Log.d(TAG, SEASONAL_IMAGE_URL_RC_FLAG + ": " + seasonalImageUrl);

    if (!seasonalImageUrl.isEmpty()) {
        // TODO: Start the splash_seasonal_image_processing here
        final Trace seasonalImageProcessingTrace = FirebasePerformance
            .startTrace("splash_seasonal_image_processing");

        // ...
    }
}
- End the trace in the both
onLoadFailed()andonResourceReady()methods of theRequestListener:
SplashScreenActivity.java
Glide.with(SplashScreenActivity.this.getApplicationContext())
    .asBitmap()
    .load(seasonalImageUrl)
    .signature(new ObjectKey(Utils.getCacheUUID()))
    .listener(new RequestListener<Bitmap>() {
        @Override
        public boolean onLoadFailed(
            @Nullable GlideException e,
            Object model, Target<Bitmap> target,
            boolean isFirstResource) {

            // TODO: Stop the splash_seasonal_image_processing here
            seasonalImageProcessingTrace.stop();

            launchMainActivity();
            return true;
        }

        @Override
        public boolean onResourceReady(Bitmap resource, Object model,
            Target<Bitmap> target, DataSource dataSource,
            boolean isFirstResource) {

            // TODO: Stop the splash_seasonal_image_processing here
            seasonalImageProcessingTrace.stop();

            launchMainActivity();
            return true;
        }
     })
     .preload();
Now that you've added custom code traces to track the splash screen duration (splash_screen_trace) and the processing time of the new feature (splash_seasonal_image_processing), run the app in Android Studio again. You should see a logging message that contains Logging trace metric: splash_screen_trace, followed by the duration of the trace. You won't see a log message for splash_seasonal_image_processing because you haven't enabled the new feature yet.
6. Add a custom attribute to the trace
For custom code traces, Performance Monitoring automatically logs default attributes (common metadata like app version, country, device, etc.) so that you can filter the data for the trace in the Firebase console. You can also add and monitor custom attributes.
In your app, you've just added two custom code traces to monitor the splash screen duration and the processing time of the new feature. A factor that might affect these durations is whether the displayed image is the default image or if the image has to be downloaded from a URL. And who knows – you might eventually have different URLs from which you download an image.
So, let's add a custom attribute representing the seasonal image URL to these custom code traces. That way, you can filter duration data by these values later on.
- Add the custom attribute (
seasonal_image_url_attribute) forsplash_screen_tracein the beginning of theexecuteTasksBasedOnRCmethod:
SplashScreenActivity.java
private void executeTasksBasedOnRC(FirebaseRemoteConfig rcConfig) {
    String seasonalImageUrl = rcConfig.getString(SEASONAL_IMAGE_URL_RC_FLAG);
    Log.d(TAG, SEASONAL_IMAGE_URL_RC_FLAG + ": " + seasonalImageUrl);

    // TODO: Add a custom attribute "seasonal_image_url_attribute" to splash_screen_trace
    if (seasonalImageUrl.isEmpty()) {
        splashScreenTrace.putAttribute("seasonal_image_url_attribute", "unset");
    } else {
        splashScreenTrace.putAttribute("seasonal_image_url_attribute", seasonalImageUrl);
    }

    // ...
}
- Add the same custom attribute for
splash_seasonal_image_processingright after thestartTrace("splash_seasonal_image_processing")call:
SplashScreenActivity.java
if (!seasonalImageUrl.isEmpty()) {
    // TODO: Start the splash_seasonal_image_processing here
    final Trace seasonalImageProcessingTrace = FirebasePerformance
        .startTrace("splash_seasonal_image_processing");

    // TODO: Add a custom attribute "seasonal_image_url_attribute" to splash_seasonal_image_processing
    seasonalImageProcessingTrace
        .putAttribute("seasonal_image_url_attribute", seasonalImageUrl);

    // ...
}
Now that you've added a custom attribute (seasonal_image_url_attribute) for both of your custom traces (splash_screen_trace and splash_seasonal_image_processing), run the app in Android Studio again. You should see a logging message that contains Setting attribute 'seasonal_image_url_attribute' to 'unset' on trace 'splash_screen_trace'. You have not yet enabled the Remote Config parameter seasonalImageUrl which is why the attribute value is unset.
The Performance Monitoring SDK will collect the trace data and send them to Firebase. You can view the data in the Performance dashboard of the Firebase console, which we'll explain in detail in the next step of the codelab.
7. Configure your Performance Monitoring dashboard
Configure your dashboard to monitor your feature
In the Firebase console, select the project that has your Friendly Eats app.
In the left panel, locate the Release & Monitor section, then click Performance.
You should see your Performance dashboard with your very first data points in your metrics board! The Performance Monitoring SDK collects performance data from your app and displays it within minutes of collection.
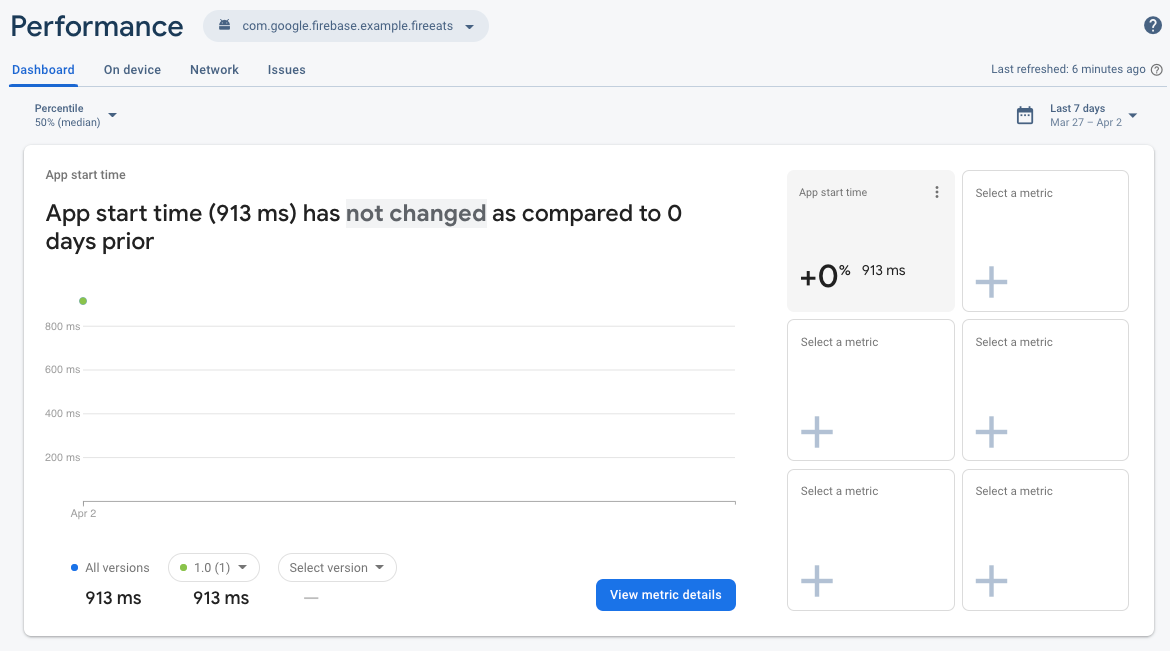
This metrics board is where you can track key metrics for your app. The default view includes the duration of your app start time trace, but you can add the metrics that you care about most. Since you're tracking the new feature that you added, you can tailor your dashboard to display the duration of the custom code trace splash_screen_trace.
- Click on one of the empty Select a metric boxes.
- In the dialog window, select the trace type of Custom traces and the trace name
splash_screen_trace.
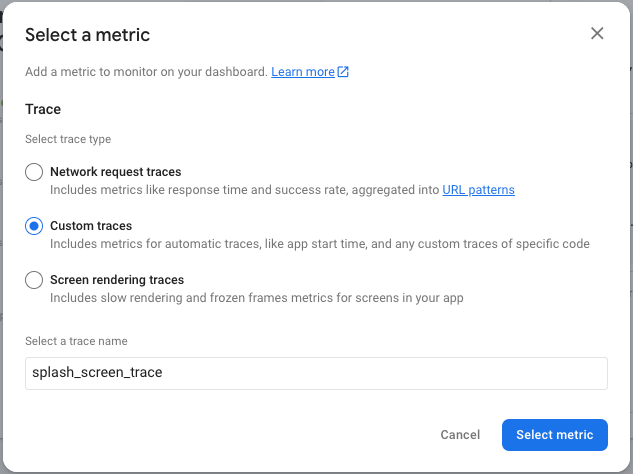
- Click Select metric, and you should see the duration of
splash_screen_traceadded to your dashboard!
You can use these same steps to add other metrics that you care about so that you can quickly see how their performance changes over time and even with different releases.
The metrics board is a powerful tool to track the performance of key metrics experienced by your users. For this codelab, you have a small set of data in a narrow time range, so you'll be using other dashboard views that will help you understand the performance of the feature rollout.
8. Roll out your feature
Now that you've set up your monitoring, you're ready to roll out the Firebase Remote Config change (seasonal_image_url) that you set up earlier.
To roll out a change, you'll go back to the Remote Config page in the Firebase console to increase the user percentile of your targeting condition. Normally, you would roll out new features to a small portion of the users and increase it only when you are confident that there are no issues with it. In this codelab, though, you're the only users of the app, so you can change the percentile to 100%.
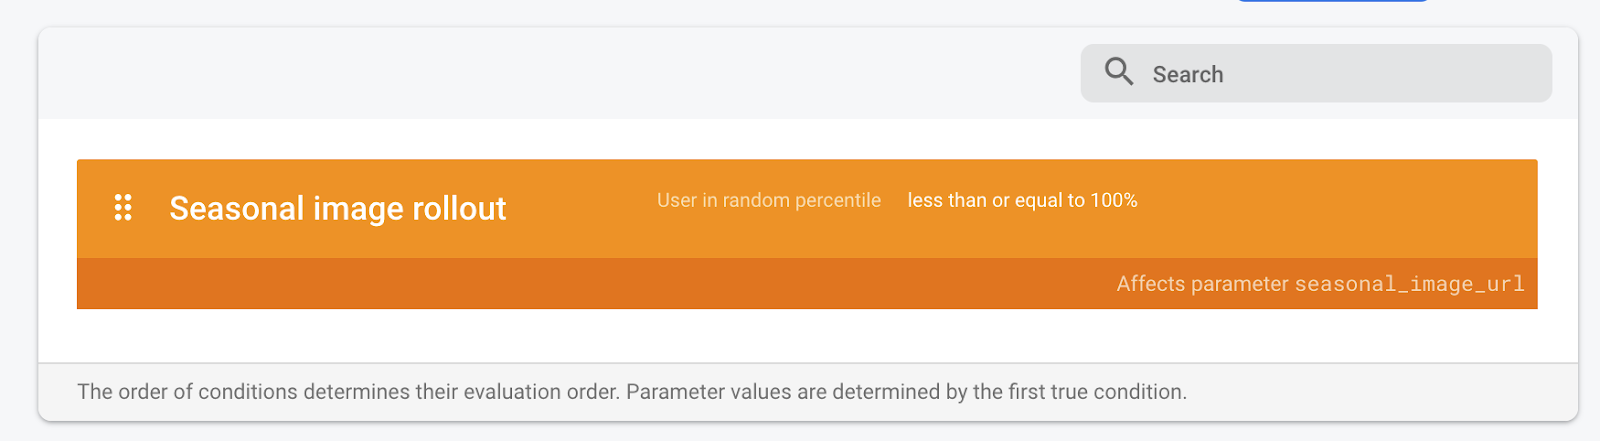
- Click the Conditions tab at the top of the page.
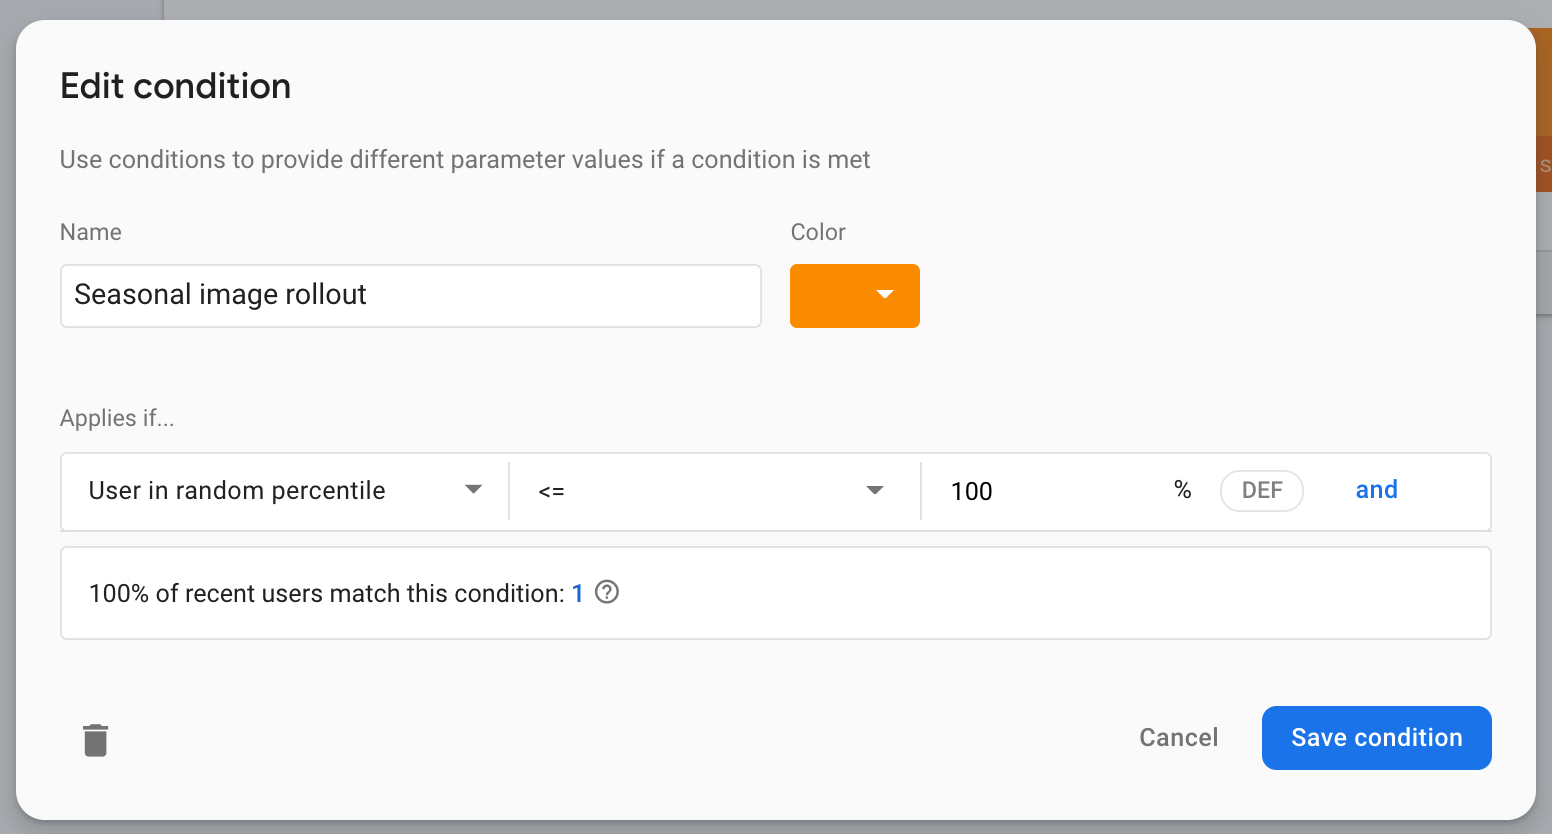
- Click the
Seasonal image rolloutcondition that you added earlier. - Change the percentile to 100%.
- Click Save condition.
- Click Publish changes and confirm the changes.
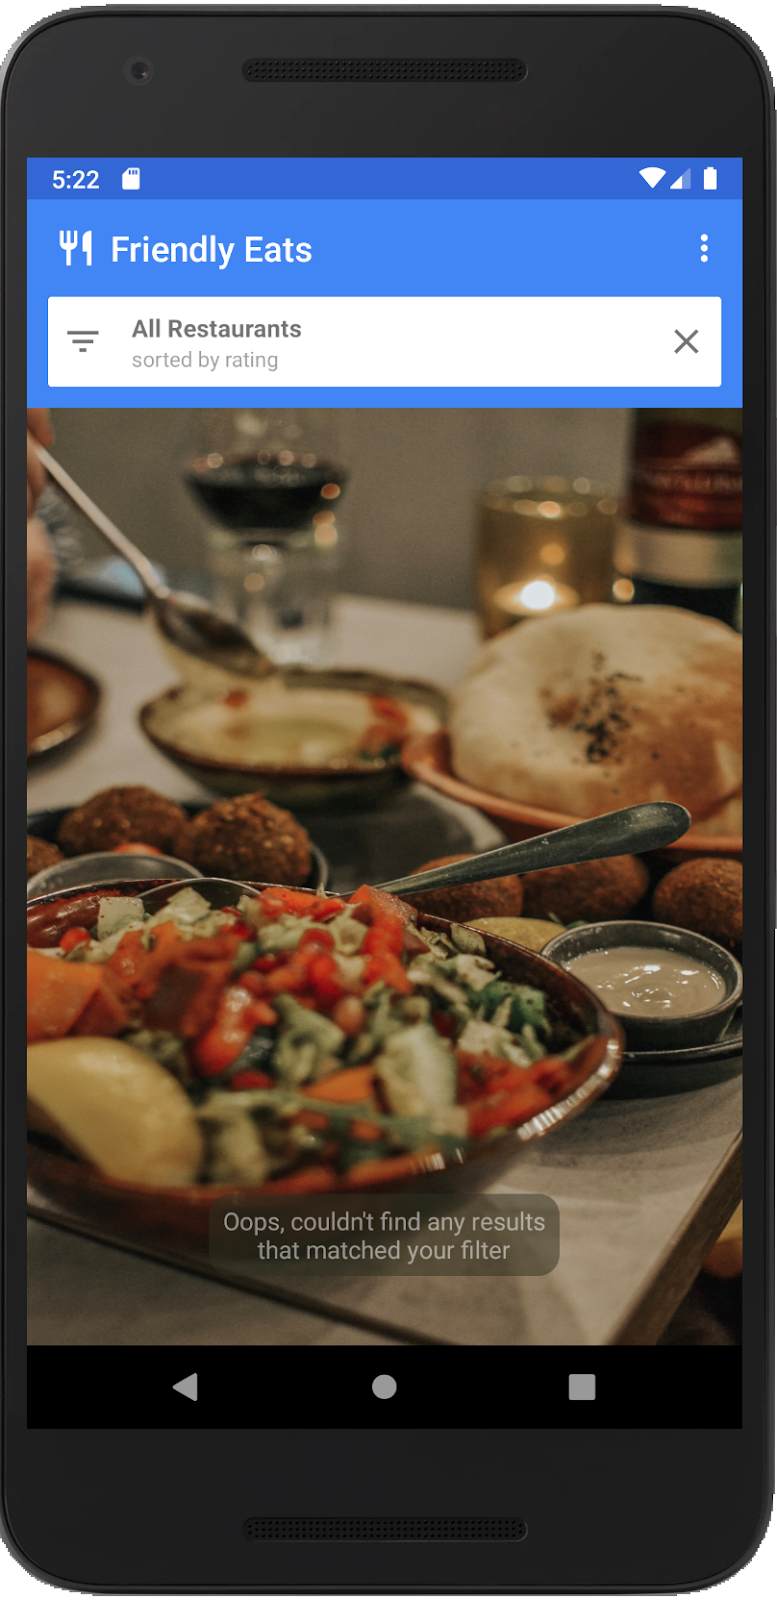
Back in Android Studio, restart the app in your emulator to see the new feature. After the splash screen, you should see the new empty state main screen!
9. Check performance changes
Now let's check out the performance of splash screen loading using the Performance dashboard in the Firebase console. In this step of the codelab, you'll use different parts of the dashboard to view performance data.
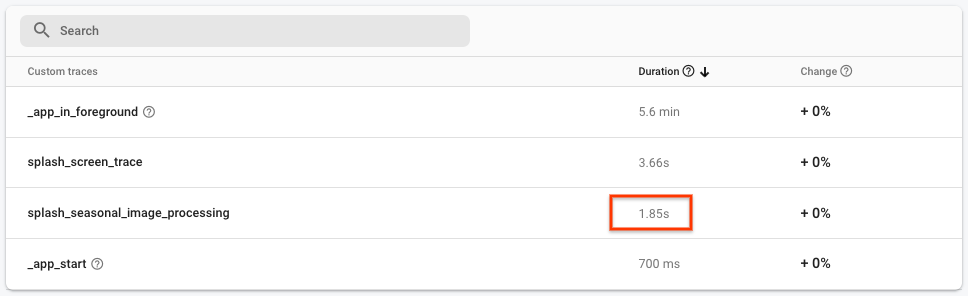
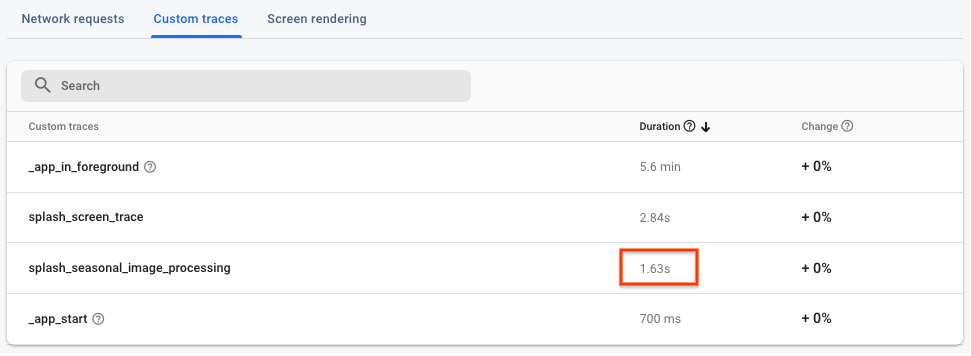
- On the main Dashboard tab, scroll down to the traces table, then click the Custom traces tab. In this table, you'll see the custom code traces you added earlier plus some out-of-the-box traces.
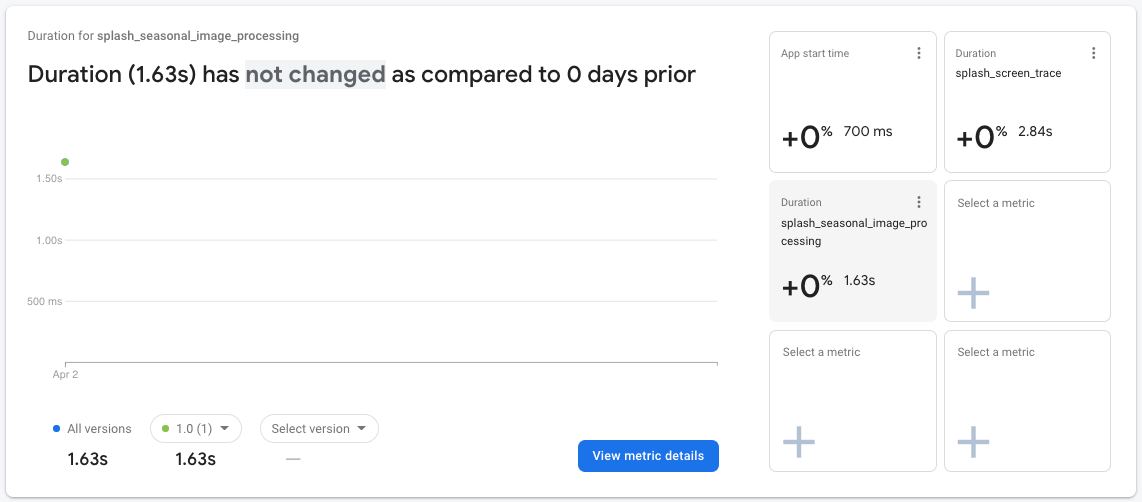
- Now that you have enabled the new feature, look for the custom code trace
splash_seasonal_image_processing, which measured the time it took to download and process the image. From the trace's Duration value, you can see that this download and processing takes a significant amount of time.
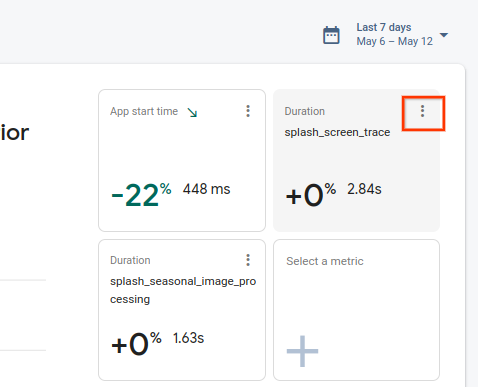
- Since you have data for
splash_seasonal_image_processing, you can add the duration of this trace to your metrics board at the top of the Dashboard tab.
Similar to before, click on one of the empty Select a metric boxes. In the dialog window, select the trace type Custom traces and the trace name splash_seasonal_image_processing. Finally, click Select metric to add this metric to the metrics board.
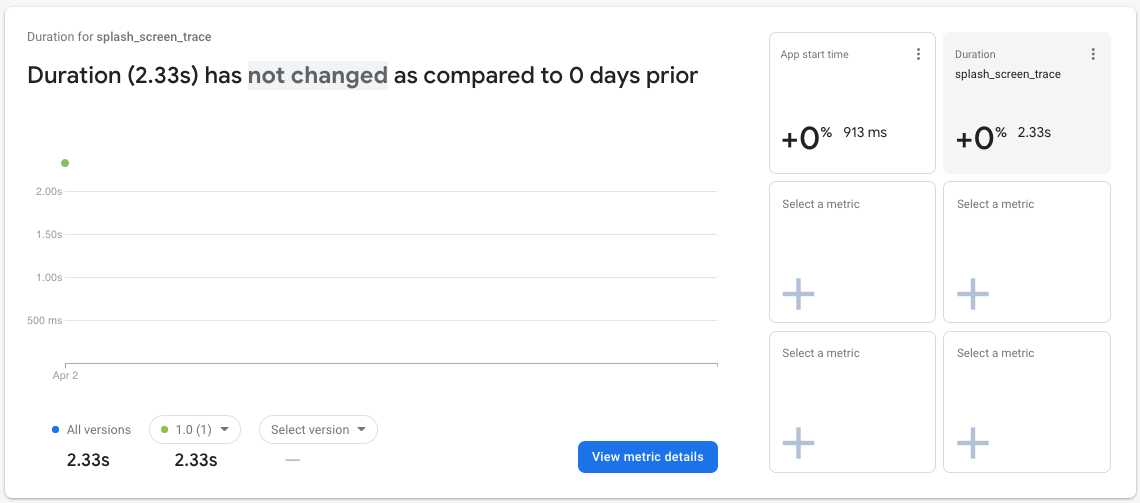
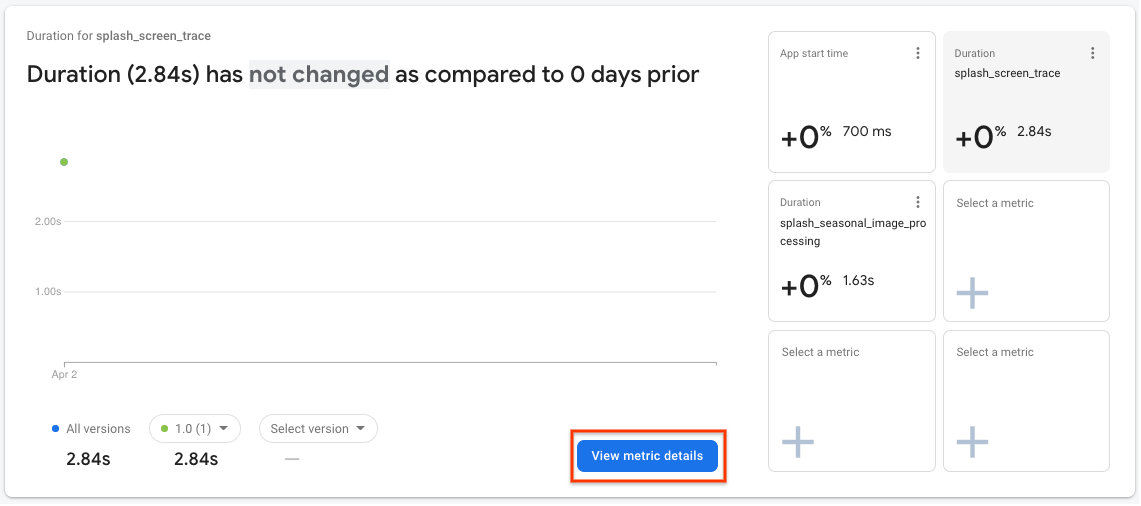
- To further confirm the differences, you can take a closer look at the data for
splash_screen_trace. Click on thesplash_screen_tracecard in the metrics board, then click View metric details.
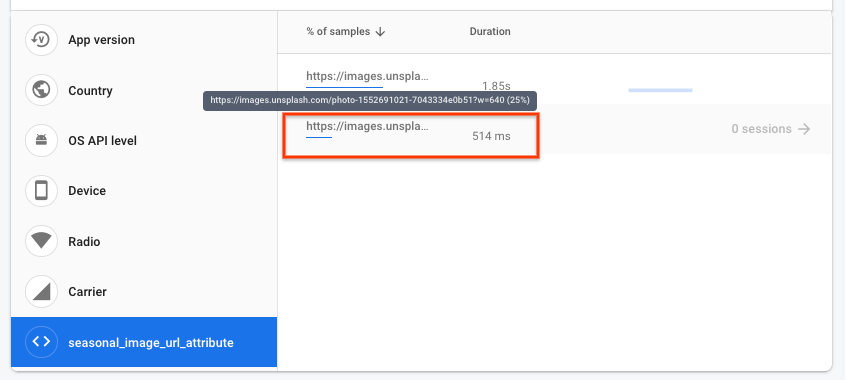
- In the details page, you'll see a list of attributes on the bottom left, including the custom attribute you created earlier. Click the custom attribute
seasonal_image_url_attributeto view the splash screen duration for each seasonal image URL on the right:
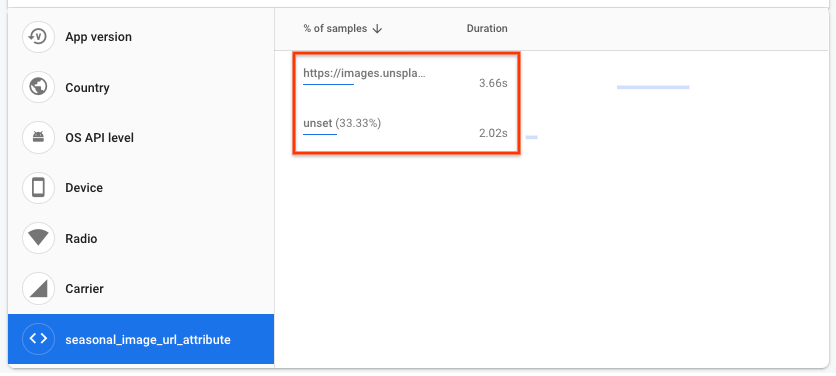
- Your splash screen duration values will probably be a bit different than those in the screenshot above, but you should have a longer duration when the image is downloaded from a URL versus using the default image (represented by "unset").
In this codelab, the reason for this longer duration might be straightforward, but in a real app, it may not be so obvious. The collected duration data will come from different devices, running the app in various network connection conditions, and these conditions could be worse than your expectation. Let's look at how you'd investigate this issue if this were a real world situation.
- Click Performance at the top of the page to go back to the Dashboard main tab:
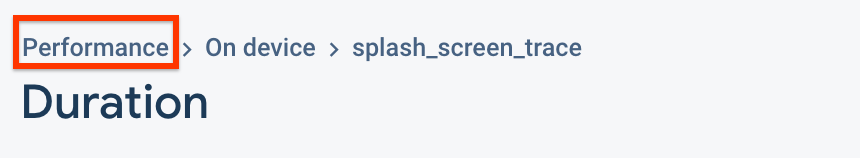
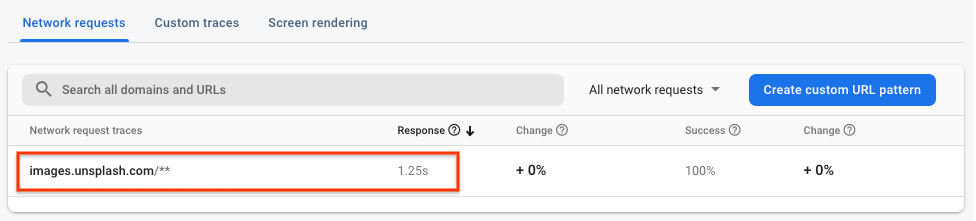
- In the traces table at the bottom of the page, click the Network requests tab. In this table, you'll see all the network requests from your app aggregated into URL patterns, including the
images.unsplash.com/**URL pattern. If you compare the value of this response time to the overall time it takes for image download and processing (i.e., the duration of thesplash_seasonal_image_processingtrace), you can see that a large amount of the time is spent on downloading the image.
Performance findings
Using Firebase Performance Monitoring, you saw the following impact on the end users with the new feature enabled:
- The time spent on
SplashScreenActivityhas increased. - The duration for
splash_seasonal_image_processingwas very large. - The delay was due to the response time for the image download and the corresponding processing time needed for the image.
In the next step, you'll mitigate the impact on performance by rolling back the feature and identifying how you can improve the implementation of the feature.
10. Roll back the feature
Increasing your users' wait time during the splash screen is not desirable. One of the key benefits of Remote Config is the ability to pause and reverse your rollout without having to release another version to your users. This allows you to quickly react to issues (like the performance issues that you discovered in the last step) and minimize the number of unhappy users.
As a fast mitigation, you'll reset the rollout percentile back to 0 so that all your users will see the default image again:
- Go back to the Remote Config page in the Firebase console.
- Click on Conditions at the top of the page.
- Click on the
Seasonal image rolloutcondition you added earlier. - Change the percentile to 0%.
- Click Save condition.
- Click Publish changes and confirm the changes.
Restart the app in Android Studio, and you should see the original empty state main screen:
11. Fix the performance issues
You discovered earlier in the codelab that downloading an image for your splash screen was causing the slowdown for your app. Taking a closer look at the downloaded image, you see that you're using the original resolution of the image, which was over 2MB! One quick fix for your performance issue is to reduce the quality to a more appropriate resolution so that the image takes less time to download.
Roll out the Remote Config value again
- Go back to the Remote Config page in the Firebase console.
- Click the Edit icon for the
seasonal_image_urlparameter. - Update the Value for Seasonal image rollout to
https://images.unsplash.com/photo-1552691021-7043334e0b51?w=640, then click Save.
- Click on the Conditions tab at the top of the page.
- Click on Seasonal image rollout, then set the percentile back to 100%.
- Click Save condition.
- Click on the Publish changes button.
12. Test the fix and set up alerts
Run the app locally
With the new config value set to use a different download image URL, run the app again. This time, you should notice that the time spent on the splash screen is shorter than before.
View the performance of the changes
Return to the Performance dashboard in the Firebase console to see how the metrics look.
- This time you'll use the traces table to navigate into the details page. Down in the traces table, in the Custom traces tab, click the custom trace
splash_seasonal_image_processingto see a more detailed view of its duration metric again.
- Click the custom attribute
seasonal_image_url_attributeto see the breakdown of the custom attributes again. If you hover over the URLs, you will see a value that matches the new URL for the reduced-size image:https://images.unsplash.com/photo-1552691021-7043334e0b51?w=640(with the?w=640at the end). The duration value associated with this image is considerably shorter than the value for the previous image and more acceptable for your users!
- Now that you have improved the performance of your splash screen, you can set up alerts to notify you when a trace exceeds a threshold that you set. Open the Performance dashboard and click the overflow menu (three dot) icon for splash_screen_trace and click Alert settings.
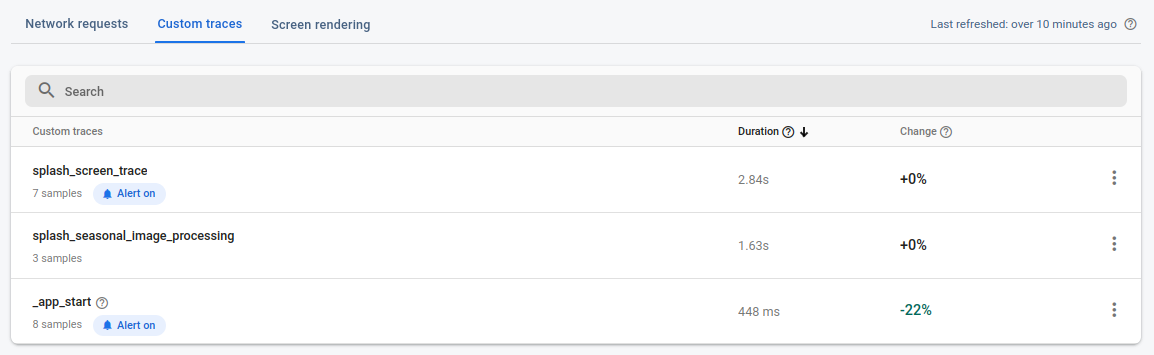
- Click the toggle to enable the Duration alert. Set the threshold value to be a little above the value you were seeing so that if your splash_screen_trace exceeds the threshold, you will receive an email.
- Click Save to create your alert. Scroll down to the traces table, then click the Custom traces tab to see that your alert is enabled!
13. Congratulations!
Congratulations! You enabled the Firebase Performance Monitoring SDK and collected traces to measure the performance of a new feature! You monitored key performance metrics for the rollout of a new feature and reacted quickly when a performance issue was discovered. This was all possible with the ability to make config changes with Remote Config and monitor for performance issues in real time.
What we've covered
- Adding the Firebase Performance Monitoring SDK to your app
- Adding a custom code trace to your code to measure a specific feature
- Setting up a Remote Config parameter and conditional value to control/rollout a new feature
- Understanding how to use the performance monitoring dashboard to identify issues during a rollout
- Setting up performance alerts to notify you when your app's performance crosses a threshold that you set