קל לארגן דפים בעזרת אוספים
אפשר לשמור ולסווג תוכן על סמך ההעדפות שלך.
Firebase Studio מציע כמה דרכים שונות לניפוי באגים באפליקציה, ישירות מסביבת העבודה. באפליקציות אינטרנט ובאפליקציות Flutter, מסוף אינטרנט ו-Lighthouse משולבים ישירות בסביבת העבודה. אפליקציות Flutter מציעות תצוגות מקדימות של Android ושל האינטרנט כדי לבדוק את האפליקציה בזמן כתיבת הקוד.
בנוסף, אפשר לבצע ניפוי באגים מבוסס נקודות עצירה בשפות הנפוצות ביותר באמצעות מסוף ניפוי הבאגים המובנה, וניתן להרחיב את האפשרויות באמצעות תוספים לניפוי באגים מ-OpenVSX. כדי לבצע ניפוי באגים בקוד האינטרנט של חזית האתר (למשל JavaScript) על סמך נקודות עצירה, אפשר להמשיך להשתמש בכלים המובנים למפתחים בדפדפן, כמו כלי הפיתוח של Chrome.
תצוגה מקדימה של האפליקציה
Firebase Studio כולל
תצוגות מקדימות של אפליקציות בסביבת העבודה לאפליקציות אינטרנט (Chrome) ולאפליקציות Flutter (Android, Chrome). תצוגות מקדימות של Android ו-Chrome תומכות בטעינה מחדש ובריענון, ומציעות יכולות מלאות של אמולטור.
שימוש במסוף האינטרנט המשולב לתצוגות מקדימות של אתרים
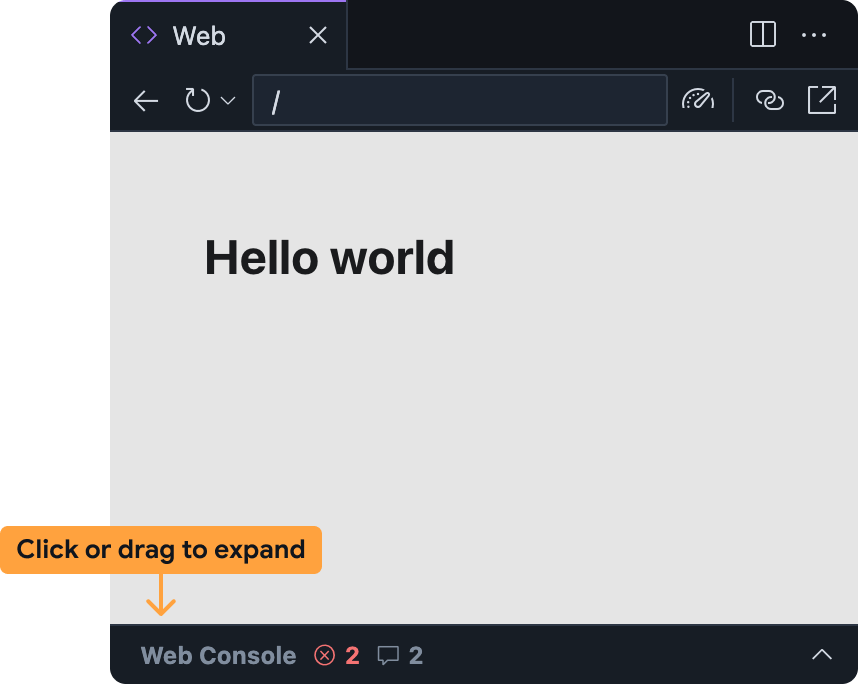
מסוף האינטרנט המשולב עוזר לכם לאבחן בעיות באפליקציה ישירות מתצוגה מקדימה באינטרנט. אפשר לגשת למסוף האינטרנט בFirebase Studioחלונית התצוגה המקדימה באינטרנט על ידי הרחבת הסרגל שבתחתית.
חשוב לזכור שזוהי תכונה ניסיונית שלא מופעלת כברירת מחדל. כדי להפעיל את התכונה, פועלים לפי השלבים הבאים ומשתפים את המשוב אחרי שמנסים אותה:
מוסיפים את מסוף האינטרנט לסביבת העבודה Firebase Studio:
פותחים את ההגדרות בלחיצה על settings או בהקשה על Ctrl + , (ב-Windows/Linux/ChromeOS) או על Cmd + , (ב-MacOS).
מחפשים את ההגדרה Firebase Studio: Web Dev Tools ומפעילים אותה. אם אתם עורכים את קובץ settings.json ישירות, אתם יכולים להוסיף "IDX.webDevTools": true.
מרעננים את חלון הדפדפן כדי לטעון מחדש את סביבת העבודה Firebase Studio.
פותחים את התצוגה המקדימה של האתר ב-Firebase Studio: פותחים את לוח הפקודות (Cmd+Shift+P ב-Mac או Ctrl+Shift+P ב-ChromeOS, ב-Windows או ב-Linux) ובוחרים באפשרות Firebase Studio: הצגת תצוגה מקדימה של האתר.
כברירת מחדל, חלונית מסוף האינטרנט ממוזערת בתוך חלונית התצוגה המקדימה של האינטרנט.
לוחצים על הסרגל או גוררים אותו למעלה כדי להרחיב אותו.
החלונית של מסוף האינטרנט בFirebase Studioתצוגה המקדימה של האינטרנט פועלת באופן דומה למסופים אחרים, כמו זה שזמין בכלי הפיתוח ל-Chrome:
שגיאות JavaScript והצהרות console.log יופיעו שם בזמן השימוש באפליקציה.
במקרה של שגיאות ואזהרות, יש גם אפשרות לקבל עזרה מ-Gemini באמצעות לחיצה על הלחצן הסבר על השגיאה הזו משמאל להודעת השגיאה.
אתם יכולים להעריך קוד JavaScript שרירותי בהקשר של התצוגה המקדימה של האתר באמצעות סרגל ההנחיות בתחתית.
הפעלת Lighthouse לתצוגות מקדימות של אתרים
Lighthouse בודק את האפליקציה על סמך קטגוריות הבדיקה הספציפיות שאתם בוחרים, ומחזיר דוח עם ממצאים והצעות. אפשר להריץ דוחות Lighthouse ישירות מתצוגה מקדימה של אתר ב-Firebase Studio.
פותחים את התצוגה המקדימה של האתר ב-Firebase Studio: פותחים את לוח הפקודות (Cmd+Shift+P ב-Mac או Ctrl+Shift+P ב-ChromeOS, Windows או Linux) ובוחרים באפשרות Firebase Studio: הצגת תצוגה מקדימה של האתר.
בסרגל הכלים של תצוגה מקדימה של אתר, לוחצים על הסמל Run Lighthouse (הפעלת Lighthouse).
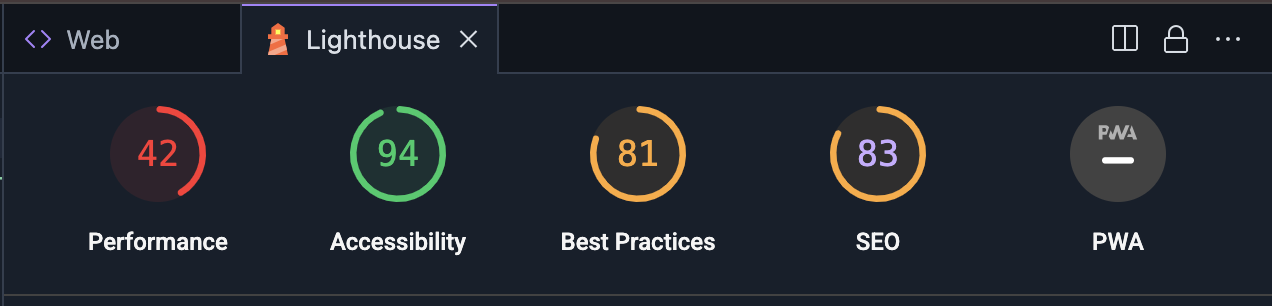
אחרי שהדוחות מופיעים בחלונית Lighthouse, אפשר לעיין בממצאים של כל קטגוריית ביקורת, או לעבור בין קטגוריות הביקורת בלחיצה על הניקוד ושם הקטגוריה.
שימוש במסוף ניפוי הבאגים
Firebase Studio כולל את מסוף ניפוי הבאגים המובנה מ-Code OSS. אפשר להשתמש במסוף הזה כדי לנפות באגים באפליקציה באמצעות כלי ניפוי באגים מוכנים מראש לרוב שפות התכנות הנפוצות, או להוסיף תוסף לניפוי באגים מ-OpenVSX.
כדי להתאים אישית את חוויית הניפוי באגים, אפשר גם להוסיף קובץ .vscode/launch.json לסביבת העבודה ולציין הגדרות הפעלה בהתאמה אישית. מידע נוסף על שימוש בקובצי הגדרות הפעלה להתאמה אישית של ניפוי באגים זמין במאמר בנושא הגדרת ניפוי באגים ב-Visual Studio Code.
ניפוי באגים באמצעות Gemini
אתם יכולים להשתמש ב-Gemini ב-Firebase כדי לנפות באגים בקוד באמצעות צ'אט בסביבת העבודה שלכם ב-Code או ב-App Prototyping agent.
Gemini יכול לכתוב קוד בשבילכם, אבל לפעמים הוא גם עלול ליצור שגיאות. אם הוא יזהה שגיאה, הוא ינסה לתקן אותה. אם אתם מגלים שהמודל לא מצליח לפתור את הבעיה בהתבסס על הודעת השגיאה, אתם יכולים לנסות כמה מהטכניקות הבאות:
מתארים את הבעיה: בממשק הצ'אט, מתארים את הבעיה שבה נתקלתם בצורה ברורה ותמציתית ככל האפשר.
יכול להיות של-Gemini תהיה גישה להקשר כמו הודעות שגיאה ויומנים, אבל יכול להיות שהיא לא תבין את ההקשר המלא. תיאור ההתנהגות, יחד עם הודעת השגיאה, יכול לעזור לצוות Gemini לתקן שגיאות
מהר יותר.
שאילת שאלות ספציפיות: אל תחששו לשאול Gemini
שאלות ישירות לגבי הקוד. לדוגמה, "מה יכול לגרום לחריגה של מצביע null בפונקציה הזו?" או "איך אפשר למנוע את מצב המירוץ הזה?"
פירוק בעיות מורכבות: אם אתם מתמודדים עם בעיה מורכבת, כדאי לפרק אותה לחלקים קטנים יותר וקלים יותר לניהול. תבקש מ-Gemini לעזור לך לנפות באגים בכל חלק בנפרד ולחשוב על הבעיות שלב אחר שלב.
שימוש בתיבות קוד: כשמשתפים קטעי קוד, חשוב להשתמש בתיבות קוד כדי לוודא שהקוד מעוצב בצורה נכונה. כך יהיה קל יותר ל-Gemini לקרוא ולהבין את הקוד שלכם.
חזרה על הפעולה ושיפור: יכול להיות ש-Gemini לא יספק את הפתרון המושלם בניסיון הראשון. בודקים את התשובות, שואלים שאלות להבהרה ומספקים מידע נוסף לפי הצורך.
הימנעות מלולאות של הנחיות: אם Gemini נתקע בלולאה או לא מצליח לענות על השאלה, כדאי לנסח מחדש את ההנחיה או לספק הקשר נוסף. לפעמים, שינוי הניסוח של השאלה עוזר ל-Gemini להבין מה אתם שואלים.
אם ניסוח מחדש של ההנחיה לא פותר את הבעיה של הלולאה, אפשר לנסות את הטכניקות הבאות:
התחלת שיחה חדשה: אם אתם משתמשים ב-Gemini בFirebase צ'אט ב-Code Workspace, התחילו שיחה חדשה כדי לאפס את ההקשר של Gemini. הפעולה הזו יכולה לעזור לכם להיפטר מכל תפיסה מוטעית או הנחה ש-Gemini יצר בשיחה הקודמת.
מספקים דוגמאות נגדיות: אם Gemini מניח הנחות שגויות, כדאי לספק דוגמאות נגדיות שיעזרו לו להבין את ההתנהגות הנכונה.
[[["התוכן קל להבנה","easyToUnderstand","thumb-up"],["התוכן עזר לי לפתור בעיה","solvedMyProblem","thumb-up"],["סיבה אחרת","otherUp","thumb-up"]],[["חסרים לי מידע או פרטים","missingTheInformationINeed","thumb-down"],["התוכן מורכב מדי או עם יותר מדי שלבים","tooComplicatedTooManySteps","thumb-down"],["התוכן לא עדכני","outOfDate","thumb-down"],["בעיה בתרגום","translationIssue","thumb-down"],["בעיה בדוגמאות/בקוד","samplesCodeIssue","thumb-down"],["סיבה אחרת","otherDown","thumb-down"]],["עדכון אחרון: 2025-07-25 (שעון UTC)."],[],[],null,["Firebase Studio offers a few different ways to debug your app, directly\nfrom your workspace. For web and Flutter apps, a web console and\n[Lighthouse](https://developer.chrome.com/docs/lighthouse/overview)\nare directly integrated into the workspace. Flutter apps offer Android and web\npreviews to spot-check and test your app while you code.\n\nRicher, breakpoint-based debugging is also available for most common languages,\nthrough the built-in Debug Console, and extensible with [Debugger extensions\nfrom OpenVSX](https://open-vsx.org/?category=Debuggers). For\nbreakpoint-based debugging of your frontend web code (like JavaScript), you can\ncontinue using your browser's built-in developer tools, like\n[Chrome's DevTools](https://developer.chrome.com/docs/devtools).\n\nPreview your app\n\nFirebase Studio includes\n[in-workspace app previews](/docs/studio/preview-apps) for web apps (Chrome)\nand Flutter apps (Android, Chrome). The\nAndroid and Chrome previews support hot reload and hot refresh, and offer full\nemulator capabilities.\n\nTo learn more about Firebase Studio previews, see\n[Preview your app](/docs/studio/preview-apps).\n\nUse the integrated web console for web previews\n\nThe integrated web console helps you diagnose issues in your app directly\nfrom the web preview. You can access the web console in the\nFirebase Studio web preview panel by expanding the bar at the bottom.\n\nNote that this feature is experimental and isn't enabled by default. To\nturn it on, follow these steps, and [share your\nfeedback](/support/troubleshooter/studio) after\nyou've tried it out:\n\n1. Add the web console to your Firebase Studio workspace:\n\n 1. Open **Settings** by clicking settings or pressing `Ctrl + ,` (on Windows/Linux/ChromeOS) or `Cmd + ,` (on MacOS).\n 2. Find the **Firebase Studio: Web Dev Tools** setting and enable it. If you're editing your `settings.json` file directly, you can add `\"IDX.webDevTools\": true`.\n 3. Refresh your browser window to reload your Firebase Studio workspace.\n2. Open the web preview in Firebase Studio: Open the command palette\n (`Cmd+Shift+P` on Mac or `Ctrl+Shift+P` on ChromeOS, Windows, or Linux)\n and select **Firebase Studio: Show Web Preview**.\n\n3. The web console panel is minimized within the web preview panel by default.\n Click the bar or drag it up to expand it.\n\nThe web console panel in the Firebase Studio web preview works\nsimilarly to other consoles, such as the one available in\n[Chrome DevTools](https://developer.chrome.com/docs/devtools):\n\n- JavaScript errors and `console.log` statements will appear there as you use your app.\n - For errors and warnings, you also have the option to get assistance from Gemini by selecting the **Understand this error** button at the right of the error message.\n- You can evaluate arbitrary JavaScript in the context of your web preview by using the prompt bar at the bottom.\n\nRun Lighthouse for web previews\n\n[Lighthouse](https://developer.chrome.com/docs/lighthouse/overview)\naudits your app based on the specific audit categories you select, and returns\na report with findings and suggestions. You can run Lighthouse reports directly\nfrom the web preview in Firebase Studio.\n\n1. Open the web preview in Firebase Studio: Open the command palette\n (`Cmd+Shift+P` on Mac or `Ctrl+Shift+P` on ChromeOS, Windows, or\n Linux) select **Firebase Studio: Show Web Preview**.\n\n2. Click the\n **Run Lighthouse** icon from the web preview toolbar.\n\n3. In\n the Lighthouse panel, select the audit categories you want. You can\n choose from reports auditing [performance](https://developer.chrome.com/docs/lighthouse/performance/performance-scoring), [accessibility](https://developer.chrome.com/docs/lighthouse/accessibility/scoring),\n [conformance with best practices](https://developer.chrome.com/docs/lighthouse/best-practices/doctype), [SEO](https://developer.chrome.com/docs/lighthouse/seo/meta-description), and [Progressive Web\n App performance](https://developer.chrome.com/docs/lighthouse/pwa/load-fast-enough-for-pwa). Click **Analyze page** to generate the reports.\n\n The reports might take a few minutes to generate.\n4. After the reports appear in the Lighthouse panel, you can review the\n findings for each audit category, or switch between audit categories by\n clicking the score and category name.\n\nUse the Debug Console\n\nFirebase Studio includes the built-in Debug Console from Code OSS. Use this\nconsole to debug your app with out-of-the-box debuggers for most common\nprogramming languages, or add a debugging extension from\n[OpenVSX](https://open-vsx.org/?category=Debuggers).\n\nTo customize your debugging experience, you can also add a `.vscode/launch.json`\nfile to your workspace and specify custom launch configurations. Learn more\nabout using launch configuration files to customize debugging at\n[Visual Studio Code debug\nconfiguration](https://github.com/microsoft/vscode-docs/blob/main/docs/debugtest/debugging-configuration.md).\n\nDebug with Gemini\n\nYou can use Gemini in Firebase to help you debug your code with\nchat in your **Code** workspace\nor the App Prototyping agent.\n\nWhile Gemini can write code for you, it might sometimes also\nproduce errors. When it detects an error, it will attempt\nto fix it. If you find that it isn't able to resolve the issue given\nthe error message, you can try some of the following techniques:\n\n- **Describe the issue:** In the chat interface, describe the\n problem you're encountering as clearly and concisely as possible.\n While Gemini might have access to context like error messages\n and logs, it might not understand the full context. Describing the behavior\n along with the error message can help Gemini fix errors\n faster.\n\n- **Ask specific questions:** Don't be afraid to ask Gemini\n direct questions about your code. For example, \"What could be causing a\n null pointer exception in this function?\" or \"How can I prevent\n this race condition?\"\n\n- **Break down complex problems:** If you're dealing with a complex\n issue, break it down into smaller, more manageable parts. Ask\n Gemini to help you debug each part separately and think\n through problems step-by-step.\n\n- **Use code fences:** When sharing code snippets, use code fences\n to ensure that the code is properly formatted. This makes it easier\n for Gemini to read and understand your code.\n\n- **Iterate and refine:** Gemini may not always provide the perfect\n solution on the first try. Review the responses, ask clarifying\n questions, and provide additional information as needed.\n\n- **Avoid prompting loops:** If Gemini gets stuck in a loop or is\n unable to answer your question, try rephrasing your prompt or\n providing additional context. Sometimes, just rewording your\n question can help Gemini understand what you're asking.\n\n If rephrasing your prompt doesn't resolve the loop, try\n the following techniques:\n - **Start a new chat:** If you're using Gemini in Firebase\n chat in your Code\n workspace, start a new chat session to reset\n Gemini's context. This can help break free from any\n misconceptions or assumptions that Gemini may have made\n in the previous conversation.\n\n - **Provide counter-examples:** If Gemini is making incorrect\n assumptions, provide counter-examples to help it understand\n the correct behavior."]]