
Firebase Studio มีวิธีต่างๆ ในการแก้ไขข้อบกพร่องของแอปโดยตรงจากพื้นที่ทำงาน สำหรับเว็บและแอป Flutter เราได้ผสานรวมคอนโซลเว็บและ Lighthouse เข้ากับพื้นที่ทำงานโดยตรง แอป Flutter มีตัวอย่าง Android และเว็บ เพื่อให้คุณตรวจสอบและทดสอบแอปขณะเขียนโค้ด
นอกจากนี้ การแก้ไขข้อบกพร่องที่ละเอียดยิ่งขึ้นตามเบรกพอยต์ยังพร้อมให้บริการสำหรับภาษาที่ใช้กันโดยทั่วไปส่วนใหญ่ ผ่านคอนโซลการแก้ไขข้อบกพร่องในตัว และขยายได้ด้วยส่วนขยายดีบักเกอร์ จาก OpenVSX สำหรับการแก้ไขข้อบกพร่องตามเบรกพอยท์ของโค้ดเว็บส่วนหน้า (เช่น JavaScript) คุณสามารถใช้เครื่องมือสำหรับนักพัฒนาซอฟต์แวร์ในตัวของเบราว์เซอร์ต่อไปได้ เช่น เครื่องมือสำหรับนักพัฒนาเว็บใน Chrome
ดูตัวอย่างแอป
Firebase Studio ประกอบด้วย ตัวอย่างแอปในพื้นที่ทำงานสำหรับเว็บแอป (Chrome) และแอป Flutter (Android, Chrome) การแสดงตัวอย่าง Android และ Chrome รองรับการโหลดซ้ำด่วนและการรีเฟรชด่วน รวมถึงมี ความสามารถของโปรแกรมจำลองอย่างเต็มรูปแบบ
ดูข้อมูลเพิ่มเติมเกี่ยวกับFirebase Studioการแสดงตัวอย่างได้ที่ แสดงตัวอย่างแอป
ใช้เว็บคอนโซลแบบผสานรวมเพื่อดูตัวอย่างเว็บ
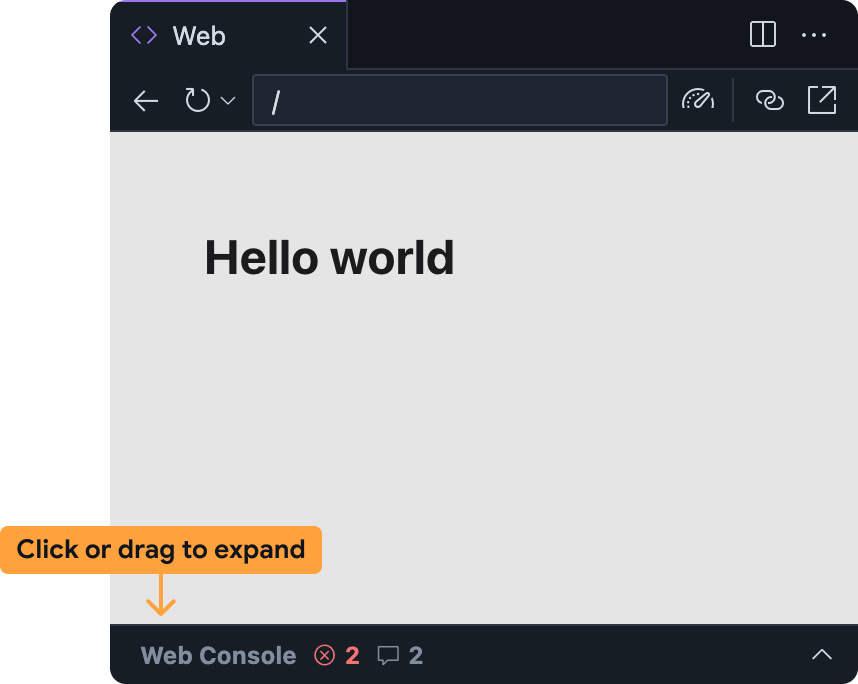
เว็บคอนโซลแบบผสานรวมจะช่วยให้คุณวินิจฉัยปัญหาในแอปได้โดยตรง จากตัวอย่างบนเว็บ คุณเข้าถึงคอนโซลเว็บได้ใน Firebase Studioแผงแสดงตัวอย่างเว็บโดยขยายแถบที่ด้านล่าง
โปรดทราบว่าฟีเจอร์นี้อยู่ในขั้นทดลองและไม่ได้เปิดใช้โดยค่าเริ่มต้น หากต้องการเปิดใช้ ให้ทำตามขั้นตอนต่อไปนี้ และแชร์ความคิดเห็นหลังจากที่ได้ลองใช้แล้ว
เพิ่มเว็บคอนโซลไปยังพื้นที่ทำงาน Firebase Studio
- เปิดการตั้งค่าโดยคลิก
หรือกด
Ctrl + ,(ใน Windows/Linux/ChromeOS) หรือCmd + ,(ใน MacOS) - ค้นหาการตั้งค่า Firebase Studio: เครื่องมือสำหรับนักพัฒนาซอฟต์แวร์บนเว็บ แล้วเปิดใช้
หากแก้ไขไฟล์
settings.jsonโดยตรง คุณจะ เพิ่ม"IDX.webDevTools": trueได้ - รีเฟรชหน้าต่างเบราว์เซอร์เพื่อโหลดFirebase Studio พื้นที่ทำงานซ้ำ
- เปิดการตั้งค่าโดยคลิก
หรือกด
เปิดตัวอย่างเว็บใน Firebase Studio: เปิดจานสีคำสั่ง (
Cmd+Shift+Pใน Mac หรือCtrl+Shift+Pใน ChromeOS, Windows หรือ Linux) แล้วเลือก Firebase Studio: แสดงตัวอย่างเว็บแผงคอนโซลเว็บจะย่อขนาดภายในแผงแสดงตัวอย่างเว็บโดยค่าเริ่มต้น คลิกแถบหรือลากขึ้นเพื่อขยาย
แผงคอนโซลเว็บในFirebase Studioตัวอย่างเว็บทำงาน คล้ายกับคอนโซลอื่นๆ เช่น คอนโซลที่มีอยู่ใน เครื่องมือสำหรับนักพัฒนาเว็บใน Chrome
- ข้อผิดพลาด JavaScript และคำสั่ง
console.logจะปรากฏที่นั่นขณะที่คุณใช้ แอป- สำหรับข้อผิดพลาดและคำเตือน คุณยังมีตัวเลือกในการรับความช่วยเหลือจาก Gemini โดย เลือกปุ่มทำความเข้าใจข้อผิดพลาดนี้ทางด้านขวาของ ข้อความแสดงข้อผิดพลาด
- คุณประเมิน JavaScript ที่กำหนดเองในบริบทของตัวอย่างเว็บได้โดยใช้แถบพรอมต์ที่ด้านล่าง
เรียกใช้ Lighthouse สำหรับตัวอย่างเว็บ
Lighthouse จะตรวจสอบแอปของคุณตามหมวดหมู่การตรวจสอบที่เฉพาะเจาะจงที่คุณเลือก และแสดง รายงานพร้อมผลการตรวจสอบและคำแนะนำ คุณเรียกใช้รายงาน Lighthouse ได้โดยตรง จากตัวอย่างเว็บใน Firebase Studio
เปิดตัวอย่างเว็บใน Firebase Studio: เปิดจานสีคำสั่ง (
Cmd+Shift+Pใน Mac หรือCtrl+Shift+Pใน ChromeOS, Windows หรือ Linux) เลือก Firebase Studio: แสดงตัวอย่างเว็บคลิกไอคอน
 เรียกใช้ Lighthouse จากแถบเครื่องมือตัวอย่างเว็บ
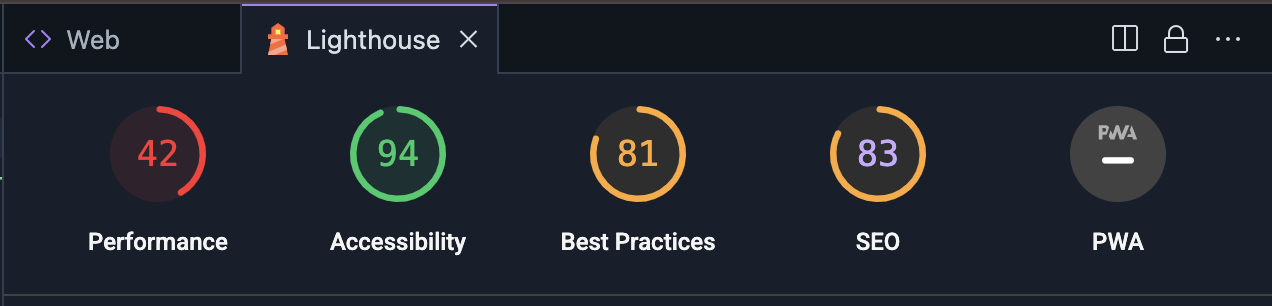 ในแผง Lighthouse ให้เลือกหมวดหมู่การตรวจสอบที่ต้องการ คุณเลือกรายงานที่ตรวจสอบประสิทธิภาพ การช่วยเหลือพิเศษ การปฏิบัติตามแนวทางปฏิบัติแนะนำ SEO และประสิทธิภาพของ Progressive Web App ได้ คลิกวิเคราะห์หน้าเว็บเพื่อสร้างรายงาน
รายงานอาจใช้เวลา 2-3 นาทีในการสร้าง
หลังจากรายงานปรากฏในแผง Lighthouse คุณสามารถตรวจสอบผลการตรวจสอบสำหรับหมวดหมู่การตรวจสอบแต่ละหมวดหมู่ หรือสลับระหว่างหมวดหมู่การตรวจสอบได้โดยคลิกคะแนนและชื่อหมวดหมู่
ใช้คอนโซลแก้ไขข้อบกพร่อง
Firebase Studio มีคอนโซลดีบักในตัวจาก Code OSS ใช้คอนโซลนี้เพื่อแก้ไขข้อบกพร่องของแอปด้วยดีบักเกอร์สำเร็จรูปสำหรับภาษาโปรแกรมที่ใช้กันมากที่สุด หรือเพิ่มส่วนขยายการแก้ไขข้อบกพร่องจาก OpenVSX
หากต้องการปรับแต่งประสบการณ์การแก้ไขข้อบกพร่อง คุณยังเพิ่ม.vscode/launch.json
ลงในพื้นที่ทำงานและระบุการกำหนดค่าการเปิดใช้ที่กำหนดเองได้ด้วย ดูข้อมูลเพิ่มเติม
เกี่ยวกับการใช้ไฟล์การกำหนดค่าการเปิดใช้เพื่อปรับแต่งการแก้ไขข้อบกพร่องได้ที่
การกำหนดค่าการแก้ไขข้อบกพร่องของ Visual Studio Code
แก้ไขข้อบกพร่องด้วย Gemini
คุณใช้ Gemini เพื่อช่วยดีบักโค้ดด้วย แชทในพื้นที่ทำงาน Code หรือ App Prototyping agent ได้
แม้ว่า Gemini จะเขียนโค้ดให้คุณได้ แต่บางครั้งก็อาจ สร้างข้อผิดพลาดได้เช่นกัน เมื่อตรวจพบข้อผิดพลาด ระบบจะพยายาม แก้ไข หากพบว่าเครื่องมือไม่สามารถแก้ปัญหาได้เมื่อได้รับข้อความแสดงข้อผิดพลาด ให้ลองใช้เทคนิคต่อไปนี้
อธิบายปัญหา: ในอินเทอร์เฟซแชท ให้อธิบายปัญหาที่คุณพบให้ชัดเจนและกระชับที่สุด แม้ว่า Gemini อาจมีสิทธิ์เข้าถึงบริบท เช่น ข้อความแสดงข้อผิดพลาด และบันทึก แต่ก็อาจไม่เข้าใจบริบททั้งหมด การอธิบายลักษณะการทำงานพร้อมกับข้อความแสดงข้อผิดพลาดจะช่วยให้ Gemini แก้ไขข้อผิดพลาด ได้เร็วขึ้น
ถามคำถามที่เจาะจง: ถามคำถามเกี่ยวกับโค้ดของคุณได้เลย ไม่ต้องเกรงใจGemini เช่น "อะไรอาจทำให้เกิด null pointer exception ในฟังก์ชันนี้" หรือ "ฉันจะป้องกัน สภาวะแข่งขันนี้ได้อย่างไร"
แบ่งปัญหาที่ซับซ้อนออกเป็นส่วนย่อยๆ: หากคุณกำลังจัดการกับปัญหาที่ซับซ้อน ให้แบ่งปัญหาออกเป็นส่วนย่อยๆ ที่จัดการได้ง่ายขึ้น ขอให้ Gemini ช่วยคุณแก้ไขข้อบกพร่องของแต่ละส่วนแยกกันและคิด แก้ปัญหาทีละขั้นตอน
ใช้ฟันหนูสำหรับโค้ด: เมื่อแชร์ข้อมูลโค้ด ให้ใช้ฟันหนูสำหรับโค้ด เพื่อให้มั่นใจว่าโค้ดได้รับการจัดรูปแบบอย่างถูกต้อง ซึ่งจะช่วยให้ Gemini อ่านและทำความเข้าใจโค้ดได้ง่ายขึ้น
ทำซ้ำและปรับแต่ง: Gemini อาจไม่ได้ให้โซลูชันที่สมบูรณ์แบบเสมอไปในครั้งแรก ตรวจสอบคำตอบ ถามคำถามเพื่อชี้แจง และให้ข้อมูลเพิ่มเติมตามที่จำเป็น
หลีกเลี่ยงการวนลูปของพรอมต์: หาก Gemini ติดอยู่ในลูปหรือตอบคำถามไม่ได้ ให้ลองเปลี่ยนคำพรอมต์หรือให้บริบทเพิ่มเติม บางครั้งเพียงแค่เปลี่ยนคำถามก็ช่วยให้ Gemini เข้าใจสิ่งที่คุณถามได้
หากการเรียบเรียงพรอมต์ใหม่ไม่ช่วยแก้ปัญหาลูป ให้ลองใช้เทคนิคต่อไปนี้
เริ่มแชทใหม่: หากคุณใช้ Gemini ในพื้นที่ทำงาน Code ให้เริ่มเซสชันการแชทใหม่เพื่อรีเซ็ตบริบทของ Gemini ซึ่งจะช่วยให้คุณหลุดพ้นจากความเข้าใจผิดหรือสมมติฐานที่ Gemini อาจมีในการสนทนาก่อนหน้า
ยกตัวอย่างที่ขัดแย้ง: หาก Gemini กำลังตั้งสมมติฐานที่ไม่ถูกต้อง ให้ยกตัวอย่างที่ขัดแย้งเพื่อช่วยให้เข้าใจ ลักษณะการทำงานที่ถูกต้อง