Performance Monitoring আপনার অ্যাপে পর্যবেক্ষণ করা প্রক্রিয়া সম্পর্কে ডেটা সংগ্রহ করতে ট্রেস ব্যবহার করে। ট্রেস হল এমন একটি রিপোর্ট যাতে আপনার অ্যাপে দুটি সময়ের মধ্যে ক্যাপচার করা ডেটা থাকে।
ওয়েব অ্যাপের জন্য, Performance Monitoring আপনার অ্যাপের প্রতিটি পৃষ্ঠার জন্য স্বয়ংক্রিয়ভাবে একটি ট্রেস সংগ্রহ করে যাকে বলা হয় পেজ লোড ট্রেস । প্রতিটি পেজ লোড ট্রেস নিম্নলিখিত ডিফল্ট মেট্রিক্স সংগ্রহ করে:
সবচেয়ে বড় কন্টেন্টফুল পেইন্ট - একটি মেট্রিক যা ব্যবহারকারী কখন একটি পৃষ্ঠায় নেভিগেট করে এবং কখন সবচেয়ে বড় দৃশ্যমান পরিবর্তন ঘটে তার মধ্যে সময় পরিমাপ করে
পরবর্তী রঙের সাথে মিথস্ক্রিয়া - একটি মেট্রিক যা ব্যবহারকারীর পৃষ্ঠার সাথে মিথস্ক্রিয়া করার সময় থেকে পরবর্তী রঙের সময়কালের মধ্যে দীর্ঘতম সময় পরিমাপ করে।
ক্রমবর্ধমান লেআউট শিফট - একটি মেট্রিক যা একটি পৃষ্ঠায় অপ্রত্যাশিত লেআউট শিফট পরিমাপ করে এবং স্কোর করে
প্রথম রঙ — একটি মেট্রিক যা ব্যবহারকারীর একটি পৃষ্ঠায় নেভিগেট করার সময় এবং কোনও দৃশ্যমান পরিবর্তনের মধ্যে সময় পরিমাপ করে।
প্রথম কন্টেন্টফুল পেইন্ট — একটি মেট্রিক যা ব্যবহারকারী কখন একটি পৃষ্ঠায় নেভিগেট করেন এবং কখন অর্থপূর্ণ কন্টেন্ট প্রদর্শিত হয়, যেমন একটি ছবি বা টেক্সট, এর মধ্যে সময় পরিমাপ করে।
domInteractive — একটি মেট্রিক যা ব্যবহারকারীর একটি পৃষ্ঠায় নেভিগেট করার সময় এবং ব্যবহারকারীর জন্য পৃষ্ঠাটি ইন্টারেক্টিভ হিসাবে বিবেচিত হওয়ার মধ্যে সময় পরিমাপ করে।
domContentLoadedEventEnd — একটি মেট্রিক যা ব্যবহারকারীর একটি পৃষ্ঠায় নেভিগেট করার সময় থেকে প্রাথমিক HTML ডকুমেন্ট সম্পূর্ণরূপে লোড এবং পার্স করার সময় পর্যন্ত সময় পরিমাপ করে।
loadEventEnd — একটি মেট্রিক যা ব্যবহারকারীর পৃষ্ঠায় নেভিগেট করার সময় এবং বর্তমান ডকুমেন্টের লোড ইভেন্ট সম্পূর্ণ হওয়ার মধ্যে সময় পরিমাপ করে।
প্রথম ইনপুট বিলম্ব — একটি মেট্রিক যা ব্যবহারকারী কখন একটি পৃষ্ঠার সাথে ইন্টারঅ্যাক্ট করে এবং ব্রাউজার কখন সেই ইনপুটে সাড়া দিতে সক্ষম হয় তার মধ্যে সময় পরিমাপ করে।
আপনি ট্রেস টেবিলের পেজ লোড সাবট্যাবে এই ট্রেসগুলি থেকে ডেটা দেখতে পারেন, যা পারফরম্যান্স ড্যাশবোর্ডের নীচে রয়েছে (এই পৃষ্ঠায় পরে কনসোল ব্যবহার সম্পর্কে আরও জানুন)।
পৃষ্ঠা লোড ট্রেসের সংজ্ঞা
এই ট্রেসটি আপনার অ্যাপের পৃষ্ঠাগুলি কীভাবে লোড হয় তার বেশ কয়েকটি মেট্রিক্স পরিমাপ করে, বিশেষ করে একটি প্রতিক্রিয়াশীল অ্যাপের মতো সাধারণ লোডিং পয়েন্টে পৌঁছাতে কত সময় লাগে।
পৃষ্ঠা লোড ট্রেস আপনার অ্যাপের মূল ওয়েব ভাইটাল ট্র্যাক করতে সাহায্য করে, যেমন প্রথম কন্টেন্টফুল পেইন্ট।
পৃষ্ঠা লোড ট্রেসের জন্য সংগৃহীত মেট্রিক্স
এই ট্রেসগুলি অপ্রচলিত, তাই আপনি এগুলিতে অতিরিক্ত কাস্টম মেট্রিক্স বা কাস্টম অ্যাট্রিবিউট যোগ করতে পারবেন না।
সবচেয়ে বড় কনটেন্টফুল পেইন্ট
এই মেট্রিকটি ব্যবহারকারী কখন একটি পৃষ্ঠায় নেভিগেট করেন এবং কখন সবচেয়ে বড় ছবি, টেক্সট বা ভিডিও কন্টেন্ট প্রদর্শিত হয় তার মধ্যে সময় পরিমাপ করে।
ওয়েব পৃষ্ঠার মূল বিষয়বস্তু ব্যবহারকারীর কাছে কত দ্রুত দৃশ্যমান হয় তা বোঝার জন্য এই মেট্রিকটি কার্যকর।
ব্যবহারকারী যখন কোনও পৃষ্ঠায় নেভিগেট করেন তখন শুরু হয়।
ছবি, টেক্সট বা ভিডিও উপাদান সহ সবচেয়ে বড় ভিজ্যুয়াল পরিবর্তন ঘটলে এটি বন্ধ হয়ে যায়। আরও বিস্তারিত জানার জন্য মূল ওয়েব ভাইটালগুলি দেখুন।
" সর্বাধিক কন্টেন্টফুল পেইন্ট এলিমেন্ট " হল একটি কাস্টম অ্যাট্রিবিউট যা সবচেয়ে বড় কন্টেন্টফুল পেইন্টের সাথে সম্পর্কিত এলিমেন্টটিকে সনাক্ত করে। এটি সবচেয়ে বড় কন্টেন্টফুল পেইন্ট টাইমিং ছাড়াও ক্যাপচার করা হয়।
পরবর্তী রঙের সাথে মিথস্ক্রিয়া
এই মেট্রিকটি ব্যবহারকারীর একটি পৃষ্ঠার সাথে ইন্টারঅ্যাক্ট করার সময় থেকে পরবর্তী পেইন্টটি কখন ঘটে তার মধ্যে সময় পরিমাপ করে।
এই মেট্রিকটি কার্যকর কারণ এটি ব্যবহারকারীর ইনপুটের প্রতি একটি পৃষ্ঠা কতটা প্রতিক্রিয়াশীল তা পরিমাপ করে।
ব্যবহারকারী যখন পৃষ্ঠার সাথে ইন্টারঅ্যাক্ট করেন (মাউস ক্লিক, ডিভাইসে ট্যাপ করা, অথবা কীবোর্ড ইনপুট) তখন শুরু হয়।
পরবর্তী রঙ করার সময় বন্ধ হয়ে যায়। আরও বিস্তারিত জানার জন্য মূল ওয়েব ভাইটালগুলি দেখুন।
" পরবর্তী রঙের সাথে দীর্ঘতম মিথস্ক্রিয়া " হল একটি কাস্টম অ্যাট্রিবিউট যা পরবর্তী রঙের সাথে মিথস্ক্রিয়ার সময় ব্যবহারকারীর সাথে মিথস্ক্রিয়া করা উপাদানটিকে চিহ্নিত করে। এটি পরবর্তী রঙের সময়কালের সাথে মিথস্ক্রিয়া ছাড়াও ক্যাপচার করা হয়।
ক্রমবর্ধমান লেআউট পরিবর্তন
এই মেট্রিকটি পৃষ্ঠার পুরো জীবনচক্রের মধ্যে ঘটে যাওয়া প্রতিটি অপ্রত্যাশিত লেআউট পরিবর্তনের জন্য লেআউট শিফটের সর্বাধিক স্কোরের পরিমাপ করে।
এই মেট্রিকটি কার্যকর কারণ অপ্রত্যাশিত লেআউট পরিবর্তন ব্যবহারকারীর অভিজ্ঞতাকে ব্যাহত করতে পারে। মেট্রিকটি লেআউট ইনস্টেবিলিটি API এর উপর ভিত্তি করে একটি স্কোর রিপোর্ট করে। স্কোর কীভাবে গণনা করা হয় সে সম্পর্কে আরও বিশদের জন্য মূল ওয়েব ভাইটালগুলি দেখুন।
" সর্বাধিক লেআউট শিফট টার্গেট " হল একটি কাস্টম অ্যাট্রিবিউট যা সবচেয়ে বড় কন্টেন্টফুল শিফট হওয়ার সময় স্থানান্তরিত উপাদানটিকে চিহ্নিত করে। এটি ক্রমবর্ধমান লেআউট শিফট স্কোরের পাশাপাশি ক্যাপচার করা হয়।
প্রথম রঙ
এই মেট্রিকটি ব্যবহারকারীর কোনও পৃষ্ঠায় নেভিগেট করার সময় এবং কোনও দৃশ্যমান পরিবর্তনের মধ্যে সময় পরিমাপ করে।
এই মেট্রিকটি কার্যকর কারণ প্রথম পেইন্টটি আপনার ব্যবহারকারীদের কাছে ইঙ্গিত দেয় যে পৃষ্ঠাটি লোড হতে শুরু করেছে ।
ব্যবহারকারী যখন কোনও পৃষ্ঠায় নেভিগেট করেন তখন শুরু হয়।
ব্যাকগ্রাউন্ডের রঙ পরিবর্তন বা হেডার লোডিং সহ যেকোনো দৃশ্যমান পরিবর্তন ঘটলে বন্ধ হয়ে যায়।
প্রথম তৃপ্তিদায়ক রঙ
এই মেট্রিকটি ব্যবহারকারী কখন একটি পৃষ্ঠায় নেভিগেট করেন এবং কখন অর্থপূর্ণ কন্টেন্ট, যেমন একটি ছবি বা টেক্সট, প্রদর্শিত হয় তার মধ্যে সময় পরিমাপ করে।
এই মেট্রিকটি আপনার ব্যবহারকারীরা আপনার অ্যাপের প্রকৃত কন্টেন্ট কত তাড়াতাড়ি দেখতে পাবে তার অন্তর্দৃষ্টির জন্য কার্যকর, শুধুমাত্র একটি নতুন ব্যাকগ্রাউন্ড রঙ বা হেডারের পরিবর্তে।
ব্যবহারকারী যখন কোনও পৃষ্ঠায় নেভিগেট করেন তখন শুরু হয়।
ব্রাউজার DOM থেকে প্রথম কন্টেন্ট রেন্ডার করার সাথে সাথেই বন্ধ হয়ে যায়, যার মধ্যে যেকোনো টেক্সট, ছবি (ব্যাকগ্রাউন্ড ইমেজ সহ), নন-হোয়াইট ক্যানভাস, অথবা SVG অন্তর্ভুক্ত থাকে।
domইন্টারেক্টিভ
এই মেট্রিকটি ব্যবহারকারীর কোনও পৃষ্ঠায় নেভিগেট করার সময় এবং ব্যবহারকারীর জন্য পৃষ্ঠাটি ইন্টারেক্টিভ হিসাবে বিবেচিত হওয়ার মধ্যে সময় পরিমাপ করে।
এই মেট্রিকটি আপনার ব্যবহারকারীরা আপনার অ্যাপের উপাদানগুলির সাথে কত তাড়াতাড়ি ইন্টারঅ্যাক্ট করতে পারবেন, যেমন বোতাম এবং হাইপারলিঙ্ক, তা কেবল স্ক্রিনে দেখার পরিবর্তে অন্তর্দৃষ্টি দেওয়ার জন্য কার্যকর। মনে রাখবেন যে এর অর্থ এই নয় যে ব্রাউজার ইন্টারঅ্যাকশনে সাড়া দেবে (এই মেট্রিকের জন্য, প্রথম ইনপুট বিলম্ব ট্রেস দেখুন)।
ব্যবহারকারী যখন কোনও পৃষ্ঠায় নেভিগেট করেন তখন শুরু হয়।
ব্যবহারকারী এজেন্ট বর্তমান HTML ডকুমেন্টের প্রস্তুতি "ইন্টারেক্টিভ" তে সেট করার ঠিক আগে বন্ধ হয়ে যায়।
domContentLoadedEventEnd
এই মেট্রিকটি ব্যবহারকারীর একটি পৃষ্ঠায় নেভিগেট করার সময় এবং প্রাথমিক HTML ডকুমেন্টটি সম্পূর্ণরূপে লোড এবং পার্স করার মধ্যে সময় পরিমাপ করে।
ব্যবহারকারী যখন কোনও পৃষ্ঠায় নেভিগেট করেন তখন শুরু হয়।
প্রাথমিক HTML ডকুমেন্ট সম্পূর্ণরূপে লোড এবং পার্স করার পরপরই বন্ধ হয়ে যায় (
DOMContentLoaded), কিন্তু এর অর্থ এই নয় যে স্টাইলশিট, ছবি এবং সাবফ্রেম লোড করা শেষ হয়েছে।
লোডইভেন্টএন্ড
এই মেট্রিকটি ব্যবহারকারীর পৃষ্ঠায় নেভিগেট করার সময় এবং বর্তমান ডকুমেন্টের লোড ইভেন্ট সম্পূর্ণ হওয়ার মধ্যে সময় পরিমাপ করে।
স্টাইলশিট এবং ছবি সহ আপনার সমস্ত কন্টেন্ট লোড হতে কত সময় লাগে তার অন্তর্দৃষ্টির জন্য এই মেট্রিকটি কার্যকর।
ব্যবহারকারী যখন কোনও পৃষ্ঠায় নেভিগেট করেন তখন শুরু হয়।
বর্তমান HTML ডকুমেন্টের লোড ইভেন্ট সম্পূর্ণ হওয়ার সাথে সাথেই বন্ধ হয়ে যায়।
প্রথম ইনপুট বিলম্ব
এই মেট্রিকটি ব্যবহারকারী কখন একটি পৃষ্ঠার সাথে ইন্টারঅ্যাক্ট করে এবং ব্রাউজার কখন সেই ইনপুটে সাড়া দিতে সক্ষম হয় তার মধ্যে সময় পরিমাপ করে।
এই মেট্রিকটি কার্যকর কারণ ব্যবহারকারীর মিথস্ক্রিয়ায় সাড়া দেওয়া ব্রাউজারটি আপনার ব্যবহারকারীদের আপনার অ্যাপের প্রতিক্রিয়াশীলতা সম্পর্কে তাদের প্রথম ধারণা দেয়।
ব্যবহারকারী যখন প্রথম পৃষ্ঠার কোনও উপাদানের সাথে ইন্টারঅ্যাক্ট করেন, যেমন একটি বোতাম বা হাইপারলিঙ্কে ক্লিক করলে এটি শুরু হয়।
ব্রাউজার ইনপুটে সাড়া দিতে সক্ষম হওয়ার সাথে সাথেই বন্ধ হয়ে যায়, যার অর্থ ব্রাউজার আপনার কন্টেন্ট লোড বা পার্সিংয়ে ব্যস্ত নয়।
মনে রাখবেন যে প্রথম ইনপুট বিলম্ব মেট্রিক পরিমাপ করার জন্য, আপনাকে এই মেট্রিকের জন্য পলিফিল লাইব্রেরি যোগ করতে হবে। ইনস্টলেশন নির্দেশাবলীর জন্য, লাইব্রেরির ডকুমেন্টেশন দেখুন।
কর্মক্ষমতা ডেটা ট্র্যাক করুন, দেখুন এবং ফিল্টার করুন
রিয়েল-টাইম পারফর্ম্যান্স ডেটা দেখতে, নিশ্চিত করুন যে আপনার অ্যাপটি এমন একটি পারফর্ম্যান্স মনিটরিং SDK সংস্করণ ব্যবহার করে যা রিয়েল-টাইম ডেটা প্রক্রিয়াকরণের সাথে সামঞ্জস্যপূর্ণ। রিয়েল-টাইম পারফর্ম্যান্স ডেটা সম্পর্কে আরও জানুন ।
আপনার ড্যাশবোর্ডে মূল মেট্রিক্স ট্র্যাক করুন
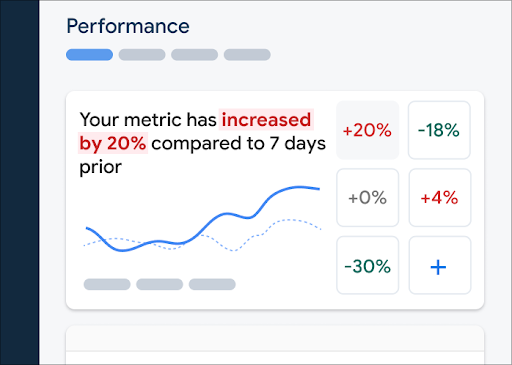
আপনার মূল মেট্রিকগুলি কীভাবে ট্রেন্ডিং করছে তা জানতে, পারফরম্যান্স ড্যাশবোর্ডের শীর্ষে আপনার মেট্রিক্স বোর্ডে সেগুলি যোগ করুন। সপ্তাহ-প্রতি-সপ্তাহের পরিবর্তনগুলি দেখে আপনি দ্রুত রিগ্রেশন সনাক্ত করতে পারেন অথবা আপনার কোডে সাম্প্রতিক পরিবর্তনগুলি কর্মক্ষমতা উন্নত করছে কিনা তা যাচাই করতে পারেন।
 "ফায়ারবেস পারফরম্যান্স মনিটরিং ড্যাশবোর্ড" />
আপনার মেট্রিক্স বোর্ডে একটি মেট্রিক যোগ করতে, এই পদক্ষেপগুলি অনুসরণ করুন:
- Firebase কনসোলের পারফরম্যান্স ড্যাশবোর্ডে যান।
- একটি খালি মেট্রিক কার্ডে ক্লিক করুন, তারপর আপনার বোর্ডে যোগ করার জন্য একটি বিদ্যমান মেট্রিক নির্বাচন করুন।
- আরও বিকল্পের জন্য, উদাহরণস্বরূপ, একটি মেট্রিক প্রতিস্থাপন বা অপসারণের জন্য, একটি পূর্ণ মেট্রিক কার্ডে এ ক্লিক করুন।
মেট্রিক্স বোর্ড সময়ের সাথে সাথে সংগৃহীত মেট্রিক ডেটা গ্রাফিক্যাল আকারে এবং সংখ্যাসূচক শতাংশ পরিবর্তন উভয়ভাবেই দেখায়।
ড্যাশবোর্ড ব্যবহার সম্পর্কে আরও জানুন।
ট্রেস এবং তাদের ডেটা দেখুন
আপনার ট্রেসগুলি দেখতে, Firebase কনসোলের পারফরম্যান্স ড্যাশবোর্ডে যান, ট্রেস টেবিলে স্ক্রোল করুন, তারপর উপযুক্ত সাবট্যাবে ক্লিক করুন। টেবিলটি প্রতিটি ট্রেসের জন্য কিছু শীর্ষ মেট্রিক্স প্রদর্শন করে এবং আপনি একটি নির্দিষ্ট মেট্রিকের শতাংশ পরিবর্তন অনুসারে তালিকাটি সাজাতে পারেন।
Firebase কনসোলে Performance Monitoring একটি সমস্যা সমাধান পৃষ্ঠা প্রদান করে যা মেট্রিক পরিবর্তনগুলিকে হাইলাইট করে, যা আপনার অ্যাপ এবং ব্যবহারকারীদের উপর পারফরম্যান্স সমস্যার দ্রুত সমাধান করা এবং প্রভাব কমানো সহজ করে তোলে। সম্ভাব্য পারফরম্যান্স সমস্যা সম্পর্কে জানতে, উদাহরণস্বরূপ, নিম্নলিখিত পরিস্থিতিতে, আপনি সমস্যা সমাধান পৃষ্ঠাটি ব্যবহার করতে পারেন:
- আপনি ড্যাশবোর্ডে প্রাসঙ্গিক মেট্রিক্স নির্বাচন করেন এবং আপনি একটি বড় ডেল্টা লক্ষ্য করেন।
- ট্রেস টেবিলে আপনি উপরে সবচেয়ে বড় ডেল্টাগুলি প্রদর্শন করার জন্য সাজান, এবং আপনি একটি উল্লেখযোগ্য শতাংশ পরিবর্তন দেখতে পাবেন।
- আপনি একটি ইমেল সতর্কতা পাবেন যেখানে আপনাকে কর্মক্ষমতা সংক্রান্ত সমস্যার বিষয়ে জানানো হবে।
আপনি নিম্নলিখিত উপায়ে সমস্যা সমাধান পৃষ্ঠাটি অ্যাক্সেস করতে পারেন:
- মেট্রিক ড্যাশবোর্ডে, মেট্রিক বিবরণ দেখুন বোতামে ক্লিক করুন।
- যেকোনো মেট্রিক কার্ডে, নির্বাচন করুন
=> বিস্তারিত দেখুন । সমস্যা সমাধান পৃষ্ঠাটি আপনার নির্বাচিত মেট্রিক সম্পর্কে তথ্য প্রদর্শন করে। - ট্রেস টেবিলে, ট্রেসের নাম অথবা সেই ট্রেসের সাথে সম্পর্কিত সারিতে থাকা যেকোনো মেট্রিক মানে ক্লিক করুন।
- একটি ইমেল সতর্কতায়, এখনই তদন্ত করুন ক্লিক করুন।
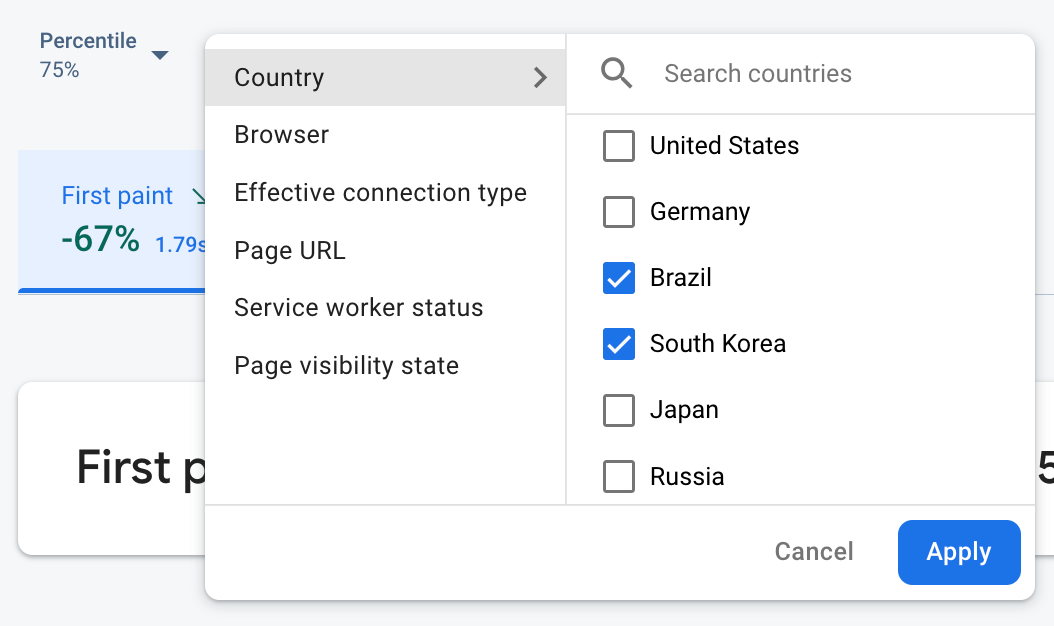
যখন আপনি ট্রেস টেবিলে একটি ট্রেস নামে ক্লিক করেন, তখন আপনি আগ্রহের মেট্রিক্সগুলি ড্রিল করতে পারেন। ক্লিক করুন
 "Firebase Performance Monitoring ডেটা অ্যাট্রিবিউট" /> দ্বারা ফিল্টার করা হচ্ছে
- আপনার সাইটের নির্দিষ্ট পৃষ্ঠার ডেটা দেখতে পৃষ্ঠার URL অনুসারে ফিল্টার করুন
- 3G সংযোগ আপনার অ্যাপকে কীভাবে প্রভাবিত করে তা জানতে কার্যকর সংযোগের ধরণ অনুসারে ফিল্টার করুন।
- আপনার ডাটাবেসের অবস্থান কোনও নির্দিষ্ট অঞ্চলকে প্রভাবিত করছে না তা নিশ্চিত করতে দেশ অনুসারে ফিল্টার করুন।
আপনার ট্রেসের ডেটা দেখার বিষয়ে আরও জানুন।
পরবর্তী পদক্ষেপ
পারফর্ম্যান্স ডেটা পরীক্ষা করার জন্য অ্যাট্রিবিউট ব্যবহার সম্পর্কে আরও জানুন।
Firebase কনসোলে কর্মক্ষমতা সংক্রান্ত সমস্যাগুলি কীভাবে ট্র্যাক করবেন সে সম্পর্কে আরও জানুন।
আপনার অ্যাপের কর্মক্ষমতা হ্রাসকারী পৃষ্ঠা লোডের জন্য সতর্কতা সেট আপ করুন । উদাহরণস্বরূপ, যদি কোনও নির্দিষ্ট পৃষ্ঠার জন্য প্রথম ইনপুট বিলম্ব আপনার সেট করা থ্রেশহোল্ড অতিক্রম করে তবে আপনি আপনার দলের জন্য একটি ইমেল সতর্কতা কনফিগার করতে পারেন।

