
Performance Monitoring collects traces to help you monitor the performance of your app. A trace is a report of performance data captured between two points in time in your app.
You can create your own traces to monitor performance data associated with specific code in your app. With a custom code trace, you can measure how long it takes your app to complete a specific task or a set of tasks, for example loading a set of images or querying your database.
The default metric for a custom code trace is its "duration" (the time between the starting and stopping points of the trace), but you can add custom metrics, as well.
In your code, you define the beginning and the end of a custom code trace using the APIs provided by the Performance Monitoring SDK. Custom code traces can be started anytime after they've been created, and they are thread safe.
Since the default metric collected for these traces is "duration", they are sometimes called "Duration traces".
You can view data from these traces in the Custom traces subtab of the traces table, which is at the bottom of the Performance dashboard (learn more about using the console later on this page).
Default attributes, custom attributes, and custom metrics
For custom code traces, Performance Monitoring automatically logs default attributes (common metadata like app version, country, device, etc.) so that you can filter the data for the trace in the Firebase console. You can also add and monitor custom attributes (such as, game level or user properties).You can further configure a custom code trace to record custom metrics for performance-related events that occur within the trace's scope. For example, you can create a custom metric for the number of cache hits and misses or the number of times that the UI becomes unresponsive for a noticeable period of time.
Custom attributes and custom metrics display in the Firebase console alongside the default attributes and default metric for the trace.
Add custom code traces
Use the Performance Monitoring Trace API (Swift | Obj-C) to add custom code traces to monitor specific application code.
Note the following:
- An app can have multiple custom code traces.
- More than one custom code trace can run at the same time.
- Names for custom code traces must meet the following requirements:
no leading or trailing whitespace, no leading underscore (
_) character, and max length is 100 characters. - Custom code traces support adding custom metrics and custom attributes.
To start and stop a custom code trace, wrap the code that you want to trace with lines of code similar to the following:
Swift
// Add the Performance Monitoring module to your header
import FirebasePerformance

let trace = Performance.startTrace(name: "CUSTOM_TRACE_NAME")

// code that you want to trace

trace.stop()
Objective-C
// Add the Performance Monitoring module to your header
@import FirebasePerformance;

FIRTrace *trace = [FIRPerformance startTraceWithName:@"CUSTOM_TRACE_NAME"];

// code that you want to trace

[trace stop];
Add custom metrics to custom code traces
Use the Performance Monitoring Trace API (Swift | Obj-C) to add custom metrics to custom code traces.
Note the following:
- Names for custom metrics must meet the following requirements:
no leading or trailing whitespace, no leading underscore (
_) character, and max length is 100 characters. - Each custom code trace can record up to 32 metrics (including the default Duration metric).
To add a custom metric, add a line of code similar to the following each time that the event occurs. For example, this custom metric counts performance- related events that occur in your app, such as cache hits or retries.
Swift
let trace = Performance.startTrace(name: "CUSTOM_TRACE_NAME")

trace.incrementMetric("EVENT_NAME", by: 1)
// code that you want to trace (and log custom metrics)

trace.stop()
Objective-C
FIRTrace *trace = [FIRPerformance startTraceWithName:@"CUSTOM_TRACE_NAME"];

[trace incrementMetric:@"EVENT_NAME" byInt:1];
// code that you want to trace (and log custom metrics)

[trace stop];
Create custom attributes for custom code traces
Use the Performance Monitoring Trace API (Swift | Obj-C) to add custom attributes to custom code traces.
To use custom attributes, add code to your app that defines the attribute and associates it with a specific custom code trace. You can set the custom attribute anytime between when the trace starts and when the trace stops.
Note the following:
Names for custom attributes must meet the following requirements:
- No leading or trailing whitespace, no leading underscore (
_) character - No spaces
- Max length is 32 characters
- Allowed characters for the name are
A-Z,a-z, and_.
- No leading or trailing whitespace, no leading underscore (
Each custom code trace can record up to 5 custom attributes.
Please ensure that custom attributes do not contain any information that personally identifies an individual to Google.
Learn more about this guideline
Swift
let trace = Performance.startTrace(name: "CUSTOM_TRACE_NAME")

trace.setValue("A", forAttribute: "experiment")

// Update scenario.
trace.setValue("B", forAttribute: "experiment")

// Reading scenario.
let experimentValue:String? = trace.valueForAttribute("experiment")

// Delete scenario.
trace.removeAttribute("experiment")

// Read attributes.
let attributes:[String, String] = trace.attributes;
Objective-C
FIRTrace *trace = [FIRPerformance startTraceWithName:@"CUSTOM_TRACE_NAME"];

[trace setValue:@"A" forAttribute:@"experiment"];

// Update scenario.
[trace setValue:@"B" forAttribute:@"experiment"];

// Reading scenario.
NSString *experimentValue = [trace valueForAttribute:@"experiment"];

// Delete scenario.
[trace removeAttribute:@"experiment"];

// Read attributes.
NSDictionary <NSString *, NSString *> *attributes = [trace attributes];
Track, view, and filter performance data
Track specific metrics in your dashboard
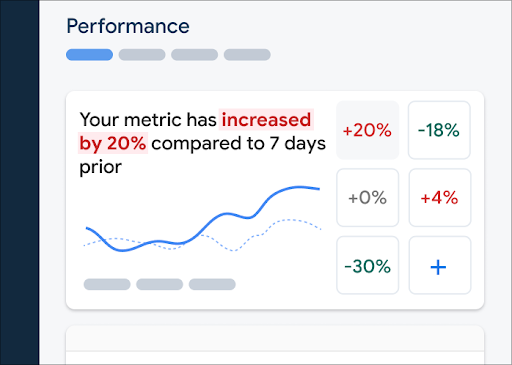
To learn how your key metrics are trending, add them to your metrics board at the top of the Performance dashboard. You can quickly identify regressions by seeing week-over-week changes or verify that recent changes in your code are improving performance.
 Firebase Performance Monitoring dashboard" />
To add a metric to your metrics board, follow these steps:
- Go to the Performance dashboardin the Firebase console.
- Click an empty metric card, then select an existing metric to add to your board.
- Click on a populated metric card for more options, for example to replace or remove a metric.
The metrics board shows collected metric data over time, both in graphical form and as a numerical percentage change.
Learn more about using the dashboard.
View traces and their data
To view your traces, go to the Performance dashboard in the Firebase console, scroll down to the traces table, then click the appropriate subtab. The table displays some top metrics for each trace, and you can even sort the list by the percentage change for a specific metric.
Performance Monitoring provides a troubleshooting page in the Firebase console that highlights metric changes, making it easy to quickly address and minimize the impact of performance issues on your apps and users. You can use the troubleshooting page when you learn about potential performance issues, for example, in the following scenarios:
- You select relevant metrics on the dashboard and you notice a big delta.
- In the traces table you sort to display the largest deltas at the top, and you see a significant percentage change.
- You receive an email alert notifying you of a performance issue.
You can access the troubleshooting page in the following ways:
- On the metric dashboard, click the View metric details button.
- On any metric card, select
=> View details . The troubleshooting page displays information about the metric you selected. - In the traces table, click a trace name or any metric value in the row associated with that trace.
- In an email alert, click Investigate now.
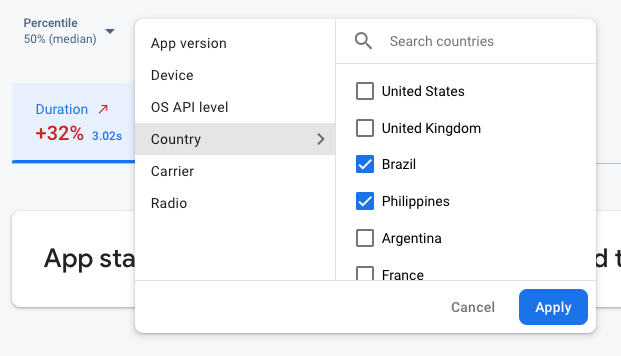
When you click a trace name in the traces table, you can then drill down into metrics of
interest. Click the
 Firebase Performance Monitoring data being filtered by attribute" />
- Filter by App version to view data about a past release or your latest release
- Filter by Device to learn how older devices handle your app
- Filter by Country to make sure your database location isn't affecting a specific region
Learn more about viewing data for your traces.
Next Steps
Learn more about using attributes to examine performance data.
Learn more about how to track performance issues in the Firebase console.
Set up alerts for code changes that are degrading the performance of your app. For example, you can configure an email alert for your team if the duration of a specific custom code trace exceeds a threshold that you set.
- View detailed reports of user sessions in which you can see a specific trace in a timeline context of other traces collected during the same session.