
Performance Monitoring uses traces to collect data about monitored processes in your app. A trace is a report that contains data captured between two points in time in your app.
For all app types, Performance Monitoring automatically collects a trace for each network request issued by your app, called an HTTP/S network request trace. These traces collect metrics for the time between when your app issues a request to a service endpoint and when the response from that endpoint is complete. For any endpoint to which your app makes a request, Performance Monitoring captures several metrics:
Response time — Time between when the request is made and when the response is fully received
Response payload size — Byte size of the network payload downloaded by the app
Request payload size — Byte size of the network payload uploaded by the app
Success rate — Percentage of successful responses (response codes in the 100 - 399 range) compared to total responses
You can view data from these traces in the Network requests subtab of the traces table, which is at the bottom of the Performance dashboard (learn more about using the console later on this page).
Customize network request data aggregation
In addition to the out-of-the-box tooling and data aggregation for network requests, Performance Monitoring also supports the following options:
- Manually instrument network request traces: The out-of-the-box monitoring includes most network requests for your app. However, some requests might not be reported or you might use a different library to make network requests. In these cases, you can use the Performance Monitoring API to manually instrument custom network request traces.
- Aggregate data under custom URL patterns: If there are specific URLs that Firebase isn't capturing with its derived automatic URL pattern matching, you can create custom URL patterns to monitor a specific set of URLs over time.
- Customize how success rate is calculated: Sometimes an error code is expected for certain API endpoints or is already handled in your app. In these cases, you can configure how the success rate is calculated and monitor the success rate of your app’s network calls more accurately.
Data aggregation under URL patterns
Firebase Performance Monitoring automatically aggregates data for similar network requests to help you understand trends in your network request performance.
For each request, Firebase checks if the network request's URL matches a URL pattern. If the request URL matches a URL pattern, Firebase automatically aggregates the request's data under the URL pattern. Firebase displays URL patterns and their aggregated data in the Network tab in the Performance dashboard of the Firebase console.
What's a URL pattern?
A URL pattern contains a domain plus a pattern that can match a URL path, for
instance: example.com/*/animals/**.
URL patterns can contain the following path segments:
- plain text — matches an exact string
*— matches any string in a single path segment**— matches an arbitrary path suffix
URL patterns can be either:
- Firebase-derived patterns — called automatic URL patterns
- User-defined patterns — called custom URL patterns
For example: Any of the following URL requests could match the URL pattern
example.com/*/animals/**.
example.com/singapore/animalsexample.com/australia/animals/spidersexample.com/australia/animals/marsupials/koala.png
The domain for a URL pattern can also contain * as its first segment,
for instance: *.example.com/*/fruits/**.
Firebase maps each request to only one URL pattern. If you've configured any custom URL patterns, Firebase attempts to match request URLs to those patterns first. If Firebase finds no matching custom URL pattern, then it matches a request URL to the most representative automatic URL pattern. Learn more about automatic and custom URL patterns in the following sections.
Automatic URL patterns
Without any configuration by you, Performance Monitoring attempts to reflect your app's latest usage behavior by matching your app's requests to automatic URL patterns.
How does automatic URL pattern matching work?
Firebase matches each request to the most representative automatic URL pattern that it has derived from requests sent by your app. Note, though, that Firebase attempts to match request URLs to any configured custom URL patterns first.
The following is a basic example for how Firebase attempts to match requests to the most representative automatic URL pattern for your app.
Your app sends many requests to URLs like:
example.com/germany/animals/bearsexample.com/germany/animals/birdsexample.com/germany/cars
Firebase determines that
example.com/germany/**is a common request pattern for your app and adds it as an automatic URL pattern in your project.For any new matching requests to this URL pattern, Firebase aggregates the requests' data under the automatic URL pattern
example.com/germany/**.After one week, the majority of your app's requests are to
example.com/germany/animals/bearsandexample.com/germany/animals/birds. So, Firebase derives a more representative URL pattern ofexample.com/germany/animals/**.For any new matching requests to this new URL pattern, Firebase aggregates the requests' data only under the new URL pattern. Firebase continues to aggregate data for requests to
example.com/germany/carsunderexample.com/germany/**.However, over the next several weeks, your app's requests to
example.com/germany/animals/bearsandexample.com/germany/animals/birdsdecrease substantially. Firebase determines thatexample.com/germany/animals/**is not representative of your app's latest usage behavior, so Firebase starts matching these two requests back toexample.com/germany/**.Firebase does not aggregate any further request data under
example.com/germany/animals/**because it's no longer the most representative automatic URL pattern.
Because automatic URL pattern matching is dynamic, be aware of the following:
Matches and aggregated data from previous requests aren't affected by new URL patterns. Firebase does not retroactively re-aggregate request data.
Only future requests are affected by new URL patterns. Firebase maps each new request to the most representative automatic URL pattern. Note, though, that Firebase attempts to match request URLs to any configured custom URL patterns first.
View automatic URL patterns and their data
Firebase displays all URL patterns and their aggregated data in the Network requests subtab of the traces table, which is at the bottom of the Performance dashboard of the Firebase console.
You might see URL patterns with an Uncategorized label. These are "broad" automatic URL patterns under which Firebase can aggregate data for requests that don't match to any more specific URL pattern.
When the data retention period ends for the data aggregated under a URL pattern, Firebase deletes that data from the URL pattern. If all the data aggregated under an automatic URL pattern expires, then Firebase deletes that URL pattern from the Firebase console.
Custom URL patterns
You can create custom URL patterns to monitor specific URL patterns that Firebase isn't capturing with its derived automatic URL pattern matching. For example, you can use a custom URL pattern to troubleshoot a specific URL or to monitor a specific set of URLs over time.
Visit Create custom URL patterns to learn more.
Track, view, and filter performance data
To view real-time performance data, make sure that your app uses a Performance Monitoring SDK version that's compatible with real-time data processing. Learn more about real-time performance data.
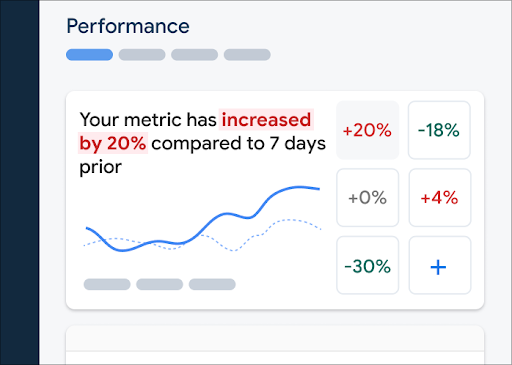
Track specific metrics in your dashboard
To learn how your key metrics are trending, add them to your metrics board at the top of the Performance dashboard. You can quickly identify regressions by seeing week-over-week changes or verify that recent changes in your code are improving performance.
 Firebase Performance Monitoring dashboard" />
To add a metric to your metrics board, follow these steps:
- Go to the Performance dashboardin the Firebase console.
- Click an empty metric card, then select an existing metric to add to your board.
- Click on a populated metric card for more options, for example to replace or remove a metric.
The metrics board shows collected metric data over time, both in graphical form and as a numerical percentage change.
Learn more about using the dashboard.
View traces and their data
To view your traces, go to the Performance dashboard in the Firebase console, scroll down to the traces table, then click the appropriate subtab. The table displays some top metrics for each trace, and you can even sort the list by the percentage change for a specific metric.
Performance Monitoring provides a troubleshooting page in the Firebase console that highlights metric changes, making it easy to quickly address and minimize the impact of performance issues on your apps and users. You can use the troubleshooting page when you learn about potential performance issues, for example, in the following scenarios:
- You select relevant metrics on the dashboard and you notice a big delta.
- In the traces table you sort to display the largest deltas at the top, and you see a significant percentage change.
- You receive an email alert notifying you of a performance issue.
You can access the troubleshooting page in the following ways:
- On the metric dashboard, click the View metric details button.
- On any metric card, select
=> View details . The troubleshooting page displays information about the metric you selected. - In the traces table, click a trace name or any metric value in the row associated with that trace.
- In an email alert, click Investigate now.
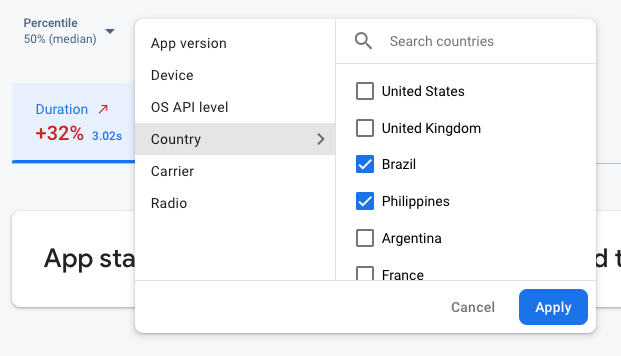
When you click a trace name in the traces table, you can then drill down into metrics of
interest. Click the
 Firebase Performance Monitoring data being filtered by attribute" />
- Filter by App version to view data about a past release or your latest release
- Filter by Device to learn how older devices handle your app
- Filter by Country to make sure your database location isn't affecting a specific region
Learn more about viewing data for your traces.
Next Steps
Learn more about using attributes to examine performance data.
Learn more about how to track performance issues in the Firebase console.
Set up alerts for network requests that are degrading the performance of your app. For example, you can configure an email alert for your team if the response time for a specific URL pattern exceeds a threshold that you set.
- View detailed reports of user sessions in which you can see a specific trace in a timeline context of other traces collected during the same session.