
Performance Monitoring 會使用追蹤記錄,收集應用程式中受監控程序的資料。追蹤記錄是一份報表,內含應用程式中兩個時間點之間擷取的資料。
如果是 Apple 和 Android 應用程式,Performance Monitoring 自動收集與應用程式生命週期相關的幾項追蹤記錄。所有這些追蹤記錄都像計時器,因為它們會測量程序執行所需的時間 (「持續時間」)。
應用程式啟動追蹤:追蹤從使用者開啟應用程式到應用程式回應操作所需要的時間
應用程式在前景執行的追蹤記錄:這項追蹤記錄會評估應用程式在前景執行且可供使用者操作的時間
應用程式在背景執行的追蹤記錄:這項追蹤記錄會測量應用程式在背景執行的時間
由於這些追蹤記錄只會收集「時間長度」指標,因此有時也稱為「時間長度追蹤記錄」。
您可以在「Performance」(效能) 資訊主頁底部的追蹤記錄表格中,查看這些追蹤記錄的資料。如要瞭解詳情,請參閱本頁稍後的主控台使用說明。
各項追蹤記錄的定義
Performance Monitoring 會使用應用程式中的方法呼叫和通知,判斷每種追蹤記錄的開始和停止時間。所有這些追蹤記錄都像是計時器,因為它們會測量程序執行所需的時間。
應用程式啟動追蹤
這項追蹤記錄會測量從使用者開啟應用程式到應用程式回應操作所需要的時間。在主控台中,追蹤記錄的名稱為 _app_start。這項追蹤記錄收集的指標是「duration」。
應用程式將第一個
Object載入記憶體時開始。應用程式收到
UIApplicationDidBecomeActiveNotification通知後,第一次成功執行迴圈時就會停止。
應用程式在前景中執行的追蹤記錄
這項追蹤記錄會測量應用程式在前台執行並供使用者使用的時間。在控制台中,追蹤記錄的名稱為 _app_in_foreground。這項追蹤記錄收集的指標是「duration」。
應用程式收到
UIApplicationDidBecomeActiveNotification通知時開始。收到
UIApplicationWillResignActiveNotification通知時停止。
應用程式在背景中執行的追蹤記錄
這項追蹤記錄會測量應用程式在背景執行的時間。在控制台中,追蹤記錄的名稱為 _app_in_background。這項追蹤記錄的指標是「時間長度」。
應用程式收到
UIApplicationWillResignActiveNotification通知時開始。收到
UIApplicationDidBecomeActiveNotification通知時停止。
這些追蹤記錄收集的指標
這些是預設追蹤記錄,因此無法新增自訂指標或自訂屬性。
所有這些追蹤記錄都像是計時器,因為它們會測量受監控程序執行的時間。這項收集到的指標名稱為「duration」。
追蹤、查看及篩選成效資料
如要查看即時效能資料,請確保應用程式使用的 Performance Monitoring SDK 版本與即時資料處理功能相容。進一步瞭解即時成效資料。
在資訊主頁中追蹤重要指標
如要瞭解主要指標的趨勢,請在「成效」資訊主頁頂端的指標面板中新增這些指標。您可以查看每週變化,快速找出迴歸問題,或確認程式碼的近期變更是否能提升成效。
 Firebase Performance Monitoring 資訊主頁" />
如要將指標新增至指標看板,請按照下列步驟操作:
- 前往 Firebase 控制台的「效能」資訊主頁。
- 按一下空白指標資訊卡,然後選取要新增至看板的現有指標。
- 按一下已填入指標的資訊卡上的 ,即可查看更多選項,例如取代或移除指標。
指標面板會以圖表和數值百分比變化兩種形式,顯示一段時間內收集到的指標資料。
進一步瞭解如何使用資訊主頁。
查看追蹤記錄及其資料
如要查看追蹤記錄,請前往 Firebase 控制台的「Performance」(效能) 資訊主頁,向下捲動至追蹤記錄表格,然後按一下適當的子分頁標籤。表格會顯示每項追蹤記錄的部分頂尖指標,您甚至可以依特定指標的百分比變化排序清單。
Performance Monitoring 會在 Firebase 控制台中提供疑難排解頁面,醒目顯示指標變化,方便您快速解決效能問題,盡量減少對應用程式和使用者的影響。當您發現潛在的效能問題時,可以使用疑難排解頁面,例如在下列情況:
- 您在資訊主頁上選取相關指標,並發現有大幅差異。
- 在追蹤記錄表格中,您會排序以在頂端顯示最大差異,並看到顯著的百分比變化。
- 您收到電子郵件快訊,通知您有效能問題。
你可以透過下列方式存取疑難排解頁面:
- 在指標資訊主頁上,按一下「查看指標詳細資料」按鈕。
- 在任一指標資訊卡上,依序選取
=>「查看詳細資料」 。疑難排解頁面會顯示所選指標的相關資訊。 - 在追蹤記錄表格中,按一下追蹤記錄名稱或與該追蹤記錄相關聯的列中任何指標值。
- 在電子郵件快訊中,按一下「立即調查」。
在追蹤記錄表格中點按追蹤記錄名稱,即可下鑽瞭解感興趣的指標。按一下「篩選」
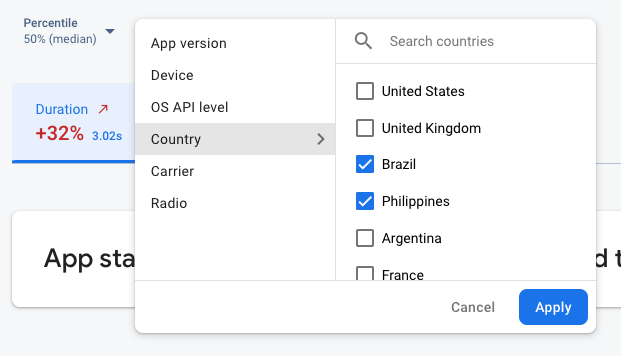 Firebase Performance Monitoring 資料,依屬性篩選" />
- 依「應用程式版本」篩選,查看先前或最新版本的資料
- 依「裝置」篩選,瞭解舊版裝置如何處理應用程式
- 依國家/地區篩選,確保資料庫位置不會影響特定區域
進一步瞭解如何查看追蹤記錄的資料。
後續步驟
進一步瞭解如何使用屬性檢查成效資料。
進一步瞭解如何在 Firebase 控制台中追蹤效能問題。
設定快訊,在程式碼變更導致應用程式效能下降時收到通知。舉例來說,如果應用程式啟動時間超過您設定的門檻,您可以為團隊設定電子郵件快訊。
- 查看使用者工作階段的詳細報表,瞭解在同一工作階段中收集的其他追蹤記錄,以及特定追蹤記錄在時間軸上的位置。