Koleksiyonlar ile düzeninizi koruyun
İçeriği tercihlerinize göre kaydedin ve kategorilere ayırın.
Performance Monitoring ile performans verilerini segmentlere ayırmak ve uygulamanızın farklı gerçek dünya senaryolarındaki performansına odaklanmak için özellikleri kullanabilirsiniz.
Performans kontrol panelinin alt kısmında bulunan izler tablosunda bir iz adını tıkladıktan sonra ilgilendiğiniz metrikleri ayrıntılı olarak inceleyebilirsiniz. Verileri özelliğe göre filtrelemek için Filtreleadd düğmesini (ekranın sol üst kısmı) kullanın. Örneğin:
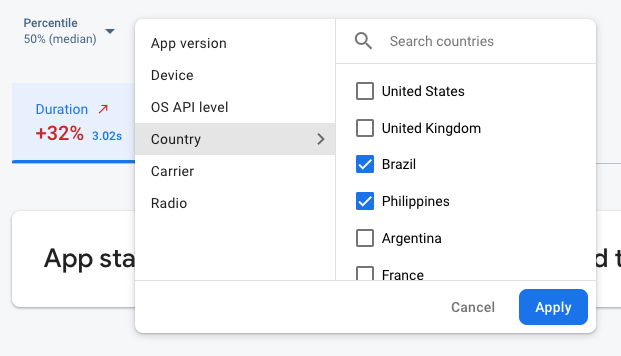
Firebase Performance Monitoring verileri özelliğe göre filtreleniyor" />
Geçmiş bir sürüm veya en son sürümünüzle ilgili verileri görüntülemek için Uygulama sürümü'ne göre filtreleme yapın.
Eski cihazların uygulamanızı nasıl işlediğini öğrenmek için Cihaz'a göre filtreleyin.
Veritabanı konumunuzun belirli bir bölgeyi etkilemediğinden emin olmak için Ülke'ye göre filtreleme
Performance Monitoring, izleme türüne bağlı olarak çeşitli varsayılan özellikleri otomatik olarak toplar.
Bu varsayılan özelliklere ek olarak, verileri uygulamanıza özel kategorilere göre segmentlere ayırmak için özel kod izlemelerinizdeözel özellikler de oluşturabilirsiniz. Örneğin, bir oyunda verileri oyun seviyesine göre segmentlere ayırabilirsiniz.
Apple ve Android uygulamaları için varsayılan özellikler
Apple ve Android uygulamaları için tüm izler varsayılan olarak aşağıdaki özellikleri toplar:
Uygulama sürümü
Ülke
İşletim sistemi düzeyi
Cihaz
Radyo
Operatör
Ayrıca ağ isteği izleri aşağıdaki özelliği de toplar:
MIME türü
Kullanıcı verilerini toplama
Özel özellikler oluşturma
Enstrümanlı özel kod izlerinizin herhangi birinde özel özellikler oluşturabilirsiniz.
Özel kod izlerine özel özellikler eklemek için Performance Monitoring Trace API'yi
(Swift
|
Obj-C)
kullanın.
Özel özellikleri kullanmak için uygulamanıza özelliği tanımlayan ve belirli bir özel kod iziyle ilişkilendiren kodu ekleyin. Özel özelliği, izleme başlatıldıktan sonra ve izleme durdurulmadan önce istediğiniz zaman ayarlayabilirsiniz.
Aşağıdakileri göz önünde bulundurun:
Özel özellik adları aşağıdaki koşulları karşılamalıdır:
Başta veya sonda boşluk yok, başta alt çizgi (_) karakteri yok
Boşluk yok
Maksimum uzunluk 32 karakterdir.
Ad için izin verilen karakterler A-Z, a-z ve _'dir.
Her özel kod izi en fazla 5 özel özellik kaydedebilir.
Lütfen özel özelliklerin, bir kişiyi Google'a tanımlayan hiçbir bilgi içermediğinden emin olun.
Bu yönerge hakkında daha fazla bilgi
Swift
Not: Bu Firebase ürünü macOS, Mac Catalyst ve watchOS hedeflerinde kullanılamaz.
[[["Anlaması kolay","easyToUnderstand","thumb-up"],["Sorunumu çözdü","solvedMyProblem","thumb-up"],["Diğer","otherUp","thumb-up"]],[["İhtiyacım olan bilgiler yok","missingTheInformationINeed","thumb-down"],["Çok karmaşık / çok fazla adım var","tooComplicatedTooManySteps","thumb-down"],["Güncel değil","outOfDate","thumb-down"],["Çeviri sorunu","translationIssue","thumb-down"],["Örnek veya kod sorunu","samplesCodeIssue","thumb-down"],["Diğer","otherDown","thumb-down"]],["Son güncelleme tarihi: 2025-08-31 UTC."],[],[],null,["\u003cbr /\u003e\n\niOS+ Android Web \n\n\u003cbr /\u003e\n\nWith Performance Monitoring, you can use attributes to segment performance data and focus\non your app's performance in different real-world scenarios.\n\nAfter you click a trace name in the traces table (located at the bottom of\nthe\n[*Performance* dashboard](//console.firebase.google.com/project/_/performance)), you can drill down into\nmetrics of interest. Use the\n**Filteradd** button\n(top-left of the screen) to filter the data by attribute, for example:\n\nFirebase Performance Monitoring data being filtered by attribute\" /\\\u003e\n\n- Filter by *App version* to view data about a past release or your latest release\n- Filter by *Device* to learn how older devices handle your app\n- Filter by *Country* to make sure your database location isn't affecting a specific region\n\nFor even more powerful analysis based on attributes,\n[export your performance data to BigQuery](/docs/perf-mon/bigquery-export).\n\nDefault attributes\n\nPerformance Monitoring automatically collects a variety of default attributes depending\non the type of trace.\n\nIn addition to these default attributes, you can also\n[create custom attributes](#create-custom-attributes) on your\n[custom code traces](/docs/perf-mon/custom-code-traces) to segment data by\ncategories specific to your app. For example, in a game, you can segment data by\ngame level.\n\nDefault attributes for Apple and Android apps\n\nAll traces for Apple and Android apps collect the following attributes by default:\n\n- App version\n- Country\n- OS level\n- Device\n- Radio\n- Carrier\n\nIn addition, network request traces also collect the following attribute:\n\n- MIME type\n\nCollecting user data **Collecting user data:** Performance Monitoring does not itself collect\n| any personally identifiable information (PII), such as names, email\n| addresses, or phone numbers. Developers can collect additional data using\n| Performance Monitoring by creating custom attributes on custom code traces. Such data collected through\n| Performance Monitoring should not contain information that personally identifies an\n| individual to Google.\n|\n| Here's an example of a log message that *does not* contain\n| personally identifiable information: \n|\n| ```java\n| trace.putAttribute(\"experiment\", \"A\");\n| ```\n|\n| Here's an example that *does* contain personally\n| identifiable information (***do not use*** this type of\n| custom attribute in your app): \n|\n| ```java\n| trace.putAttribute(\"email\", user.getEmailAddress());\n| ```\n|\n| Data that exposes any personally identifiable information is subject to\n| deletion without notice.\n\nCreate custom attributes\n\nYou can create custom attributes on any of your instrumented\n[custom code traces](/docs/perf-mon/custom-code-traces).\n\nUse the Performance Monitoring Trace API\n([Swift](/docs/reference/swift/firebaseperformance/api/reference/Classes/Trace)\n\\|\n[Obj-C](/docs/reference/ios/firebaseperformance/api/reference/Classes/FIRTrace))\nto add custom attributes to custom code traces.\n\nTo use custom attributes, add code to your app that defines the attribute and\nassociates it with a specific custom code trace. You can set the custom\nattribute anytime between when the trace starts and when the trace stops.\n\nNote the following:\n\n- Names for custom attributes must meet the following requirements:\n\n - No leading or trailing whitespace, no leading underscore (`_`) character\n - No spaces\n - Max length is 32 characters\n - Allowed characters for the name are `A-Z`, `a-z`, and `_`.\n- Each custom code trace can record up to 5 custom attributes.\n\n- Please ensure that custom attributes do not contain any information that\n personally identifies an individual to Google.\n\n Learn more about this guideline\n | **Collecting user data:** Performance Monitoring does not itself collect\n | any personally identifiable information (PII), such as names, email\n | addresses, or phone numbers. Developers can collect additional data using\n | Performance Monitoring by creating custom attributes on custom code traces. Such data collected through\n | Performance Monitoring should not contain information that personally identifies an\n | individual to Google.\n |\n | Here's an example of a log message that *does not* contain\n | personally identifiable information: \n |\n | ```java\n | trace.putAttribute(\"experiment\", \"A\");\n | ```\n |\n | Here's an example that *does* contain personally\n | identifiable information (***do not use*** this type of\n | custom attribute in your app): \n |\n | ```java\n | trace.putAttribute(\"email\", user.getEmailAddress());\n | ```\n |\n | Data that exposes any personally identifiable information is subject to\n | deletion without notice.\n\nSwift\n\n\n**Note:** This Firebase product is not available on macOS, Mac Catalyst, watchOS targets. \n\n```swift\nlet trace = Performance.startTrace(name: \"\u003cvar class=\"readonly\" translate=\"no\"\u003eCUSTOM_TRACE_NAME\u003c/var\u003e\")\n\ntrace.setValue(\"A\", forAttribute: \"experiment\")\n\n// Update scenario.\ntrace.setValue(\"B\", forAttribute: \"experiment\")\n\n// Reading scenario.\nlet experimentValue:String? = trace.valueForAttribute(\"experiment\")\n\n// Delete scenario.\ntrace.removeAttribute(\"experiment\")\n\n// Read attributes.\nlet attributes:[String, String] = trace.attributes;\n```\n\nObjective-C\n\n\n**Note:** This Firebase product is not available on macOS, Mac Catalyst, watchOS targets. \n\n```objective-c\nFIRTrace *trace = [FIRPerformance startTraceWithName:@\"\u003cvar class=\"readonly\" translate=\"no\"\u003eCUSTOM_TRACE_NAME\u003c/var\u003e\"];\n\n[trace setValue:@\"A\" forAttribute:@\"experiment\"];\n\n// Update scenario.\n[trace setValue:@\"B\" forAttribute:@\"experiment\"];\n\n// Reading scenario.\nNSString *experimentValue = [trace valueForAttribute:@\"experiment\"];\n\n// Delete scenario.\n[trace removeAttribute:@\"experiment\"];\n\n// Read attributes.\nNSDictionary \u003cNSString *, NSString *\u003e *attributes = [trace attributes];\n```"]]