Zadbaj o dobrą organizację dzięki kolekcji
Zapisuj i kategoryzuj treści zgodnie ze swoimi preferencjami.
Performance Monitoring umożliwia segmentowanie danych o skuteczności za pomocą atrybutów i skupianie się na wynikach aplikacji w różnych rzeczywistych scenariuszach.
Po kliknięciu nazwy śladu w tabeli śladów (u dołu panelu Wydajność) możesz przejść do szczegółowych danych, które Cię interesują. Użyj przycisku Filtrujadd (w lewym górnym rogu ekranu), aby filtrować dane według atrybutu, np.:
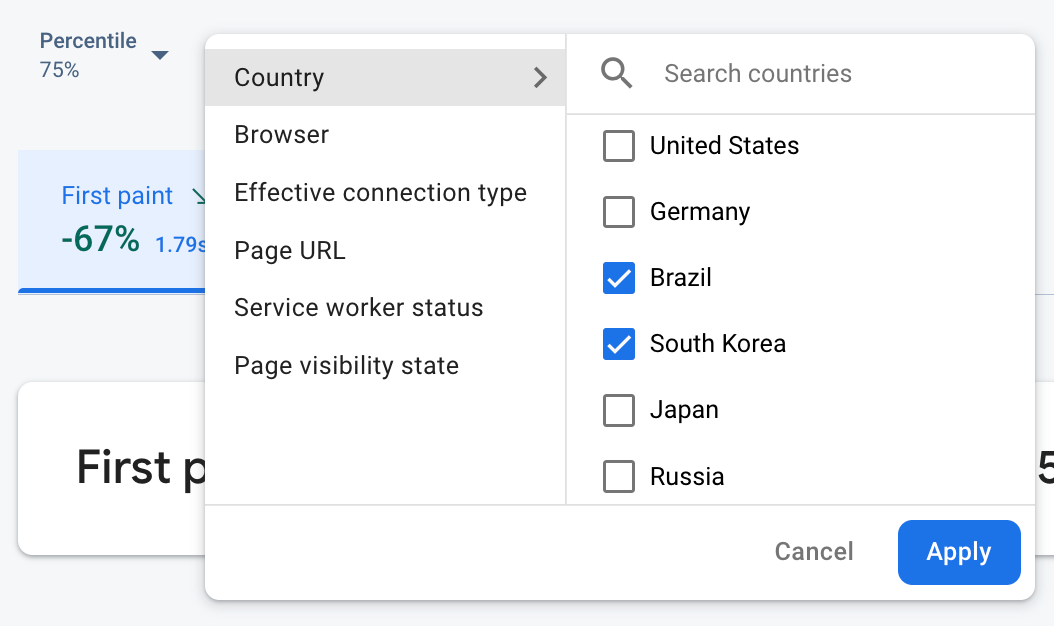
Dane monitorowania wydajności Firebase filtrowane według atrybutu" />
Filtruj według adresu URL strony, aby wyświetlić dane dotyczące konkretnej strony witryny.
Filtruj według Użytego rodzaju połączenia, aby dowiedzieć się, jak połączenie 3G wpływa na Twoją aplikację.
Filtruj według kraju, aby sprawdzić, czy lokalizacja bazy danych nie wpływa na określony region.
Atrybuty domyślne
Performance Monitoring automatycznie zbiera różne atrybuty domyślne w zależności od typu śladu.
Oprócz tych atrybutów domyślnych możesz też tworzyć atrybuty niestandardowe w niestandardowych śladach kodu, aby segmentować dane według kategorii specyficznych dla Twojej aplikacji. Na przykład w grze możesz segmentować dane według poziomu gry.
Domyślne atrybuty zbierane w przypadku aplikacji internetowych
Wszystkie ślady w przypadku aplikacji internetowych domyślnie zbierają te atrybuty:
Aby używać atrybutów niestandardowych, dodaj do aplikacji kod, który definiuje atrybut i wiąże go z określonym śladem kodu niestandardowego. Atrybut niestandardowy możesz ustawić w dowolnym momencie od rozpoczęcia do zakończenia śledzenia.
Pamiętaj:
Nazwy atrybutów niestandardowych muszą spełniać te wymagania:
Brak spacji na początku i na końcu, brak znaku podkreślenia (_) na początku.
Brak pokoi
Maksymalna długość to 32 znaki.
Dozwolone znaki w nazwie to A-Z, a-z i _.
Każdy ślad kodu niestandardowego może rejestrować maksymalnie 5 atrybutów niestandardowych.
Upewnij się, że atrybuty niestandardowe nie zawierają żadnych informacji, które umożliwiają Google identyfikację konkretnej osoby.
[[["Łatwo zrozumieć","easyToUnderstand","thumb-up"],["Rozwiązało to mój problem","solvedMyProblem","thumb-up"],["Inne","otherUp","thumb-up"]],[["Brak potrzebnych mi informacji","missingTheInformationINeed","thumb-down"],["Zbyt skomplikowane / zbyt wiele czynności do wykonania","tooComplicatedTooManySteps","thumb-down"],["Nieaktualne treści","outOfDate","thumb-down"],["Problem z tłumaczeniem","translationIssue","thumb-down"],["Problem z przykładami/kodem","samplesCodeIssue","thumb-down"],["Inne","otherDown","thumb-down"]],["Ostatnia aktualizacja: 2025-09-05 UTC."],[],[],null,["\u003cbr /\u003e\n\niOS+ Android Web \n\n\u003cbr /\u003e\n\nWith Performance Monitoring, you can use attributes to segment performance data and focus\non your app's performance in different real-world scenarios.\n\nAfter you click a trace name in the traces table (located at the bottom of\nthe\n[*Performance* dashboard](//console.firebase.google.com/project/_/performance)), you can drill down into\nmetrics of interest. Use the\n**Filteradd** button\n(top-left of the screen) to filter the data by attribute, for example:\n\nFirebase Performance Monitoring data being filtered by attribute\" /\\\u003e\n\n- Filter by *App version* to view data about a past release or your latest release\n- Filter by *Device* to learn how older devices handle your app\n- Filter by *Country* to make sure your database location isn't affecting a specific region\n\nFor even more powerful analysis based on attributes,\n[export your performance data to BigQuery](/docs/perf-mon/bigquery-export).\n\nDefault attributes\n\nPerformance Monitoring automatically collects a variety of default attributes depending\non the type of trace.\n\nIn addition to these default attributes, you can also\n[create custom attributes](#create-custom-attributes) on your\n[custom code traces](/docs/perf-mon/custom-code-traces) to segment data by\ncategories specific to your app. For example, in a game, you can segment data by\ngame level.\n\nDefault attributes for Apple and Android apps\n\nAll traces for Apple and Android apps collect the following attributes by default:\n\n- App version\n- Country\n- OS level\n- Device\n- Radio\n- Carrier\n\nIn addition, network request traces also collect the following attribute:\n\n- MIME type\n\nCollecting user data **Collecting user data:** Performance Monitoring does not itself collect\n| any personally identifiable information (PII), such as names, email\n| addresses, or phone numbers. Developers can collect additional data using\n| Performance Monitoring by creating custom attributes on custom code traces. Such data collected through\n| Performance Monitoring should not contain information that personally identifies an\n| individual to Google.\n|\n| Here's an example of a log message that *does not* contain\n| personally identifiable information: \n|\n| ```java\n| trace.putAttribute(\"experiment\", \"A\");\n| ```\n|\n| Here's an example that *does* contain personally\n| identifiable information (***do not use*** this type of\n| custom attribute in your app): \n|\n| ```java\n| trace.putAttribute(\"email\", user.getEmailAddress());\n| ```\n|\n| Data that exposes any personally identifiable information is subject to\n| deletion without notice.\n\nCreate custom attributes\n\nYou can create custom attributes on any of your instrumented\n[custom code traces](/docs/perf-mon/custom-code-traces).\n\nUse the Performance Monitoring Trace API\n([Swift](/docs/reference/swift/firebaseperformance/api/reference/Classes/Trace)\n\\|\n[Obj-C](/docs/reference/ios/firebaseperformance/api/reference/Classes/FIRTrace))\nto add custom attributes to custom code traces.\n\nTo use custom attributes, add code to your app that defines the attribute and\nassociates it with a specific custom code trace. You can set the custom\nattribute anytime between when the trace starts and when the trace stops.\n\nNote the following:\n\n- Names for custom attributes must meet the following requirements:\n\n - No leading or trailing whitespace, no leading underscore (`_`) character\n - No spaces\n - Max length is 32 characters\n - Allowed characters for the name are `A-Z`, `a-z`, and `_`.\n- Each custom code trace can record up to 5 custom attributes.\n\n- Please ensure that custom attributes do not contain any information that\n personally identifies an individual to Google.\n\n Learn more about this guideline\n | **Collecting user data:** Performance Monitoring does not itself collect\n | any personally identifiable information (PII), such as names, email\n | addresses, or phone numbers. Developers can collect additional data using\n | Performance Monitoring by creating custom attributes on custom code traces. Such data collected through\n | Performance Monitoring should not contain information that personally identifies an\n | individual to Google.\n |\n | Here's an example of a log message that *does not* contain\n | personally identifiable information: \n |\n | ```java\n | trace.putAttribute(\"experiment\", \"A\");\n | ```\n |\n | Here's an example that *does* contain personally\n | identifiable information (***do not use*** this type of\n | custom attribute in your app): \n |\n | ```java\n | trace.putAttribute(\"email\", user.getEmailAddress());\n | ```\n |\n | Data that exposes any personally identifiable information is subject to\n | deletion without notice.\n\nSwift\n\n\n**Note:** This Firebase product is not available on macOS, Mac Catalyst, watchOS targets. \n\n```swift\nlet trace = Performance.startTrace(name: \"\u003cvar class=\"readonly\" translate=\"no\"\u003eCUSTOM_TRACE_NAME\u003c/var\u003e\")\n\ntrace.setValue(\"A\", forAttribute: \"experiment\")\n\n// Update scenario.\ntrace.setValue(\"B\", forAttribute: \"experiment\")\n\n// Reading scenario.\nlet experimentValue:String? = trace.valueForAttribute(\"experiment\")\n\n// Delete scenario.\ntrace.removeAttribute(\"experiment\")\n\n// Read attributes.\nlet attributes:[String, String] = trace.attributes;\n```\n\nObjective-C\n\n\n**Note:** This Firebase product is not available on macOS, Mac Catalyst, watchOS targets. \n\n```objective-c\nFIRTrace *trace = [FIRPerformance startTraceWithName:@\"\u003cvar class=\"readonly\" translate=\"no\"\u003eCUSTOM_TRACE_NAME\u003c/var\u003e\"];\n\n[trace setValue:@\"A\" forAttribute:@\"experiment\"];\n\n// Update scenario.\n[trace setValue:@\"B\" forAttribute:@\"experiment\"];\n\n// Reading scenario.\nNSString *experimentValue = [trace valueForAttribute:@\"experiment\"];\n\n// Delete scenario.\n[trace removeAttribute:@\"experiment\"];\n\n// Read attributes.\nNSDictionary \u003cNSString *, NSString *\u003e *attributes = [trace attributes];\n```"]]