קל לארגן דפים בעזרת אוספים
אפשר לשמור ולסווג תוכן על סמך ההעדפות שלך.
בעזרת Performance Monitoring, אפשר להשתמש במאפיינים כדי לפלח את נתוני הביצועים ולהתמקד בביצועי האפליקציה בתרחישים שונים בעולם האמיתי.
אחרי שלוחצים על שם של מעקב בטבלת המעקבים (שנמצאת בתחתית לוח הבקרה ביצועים), אפשר להציג מדדים ספציפיים. משתמשים בלחצן
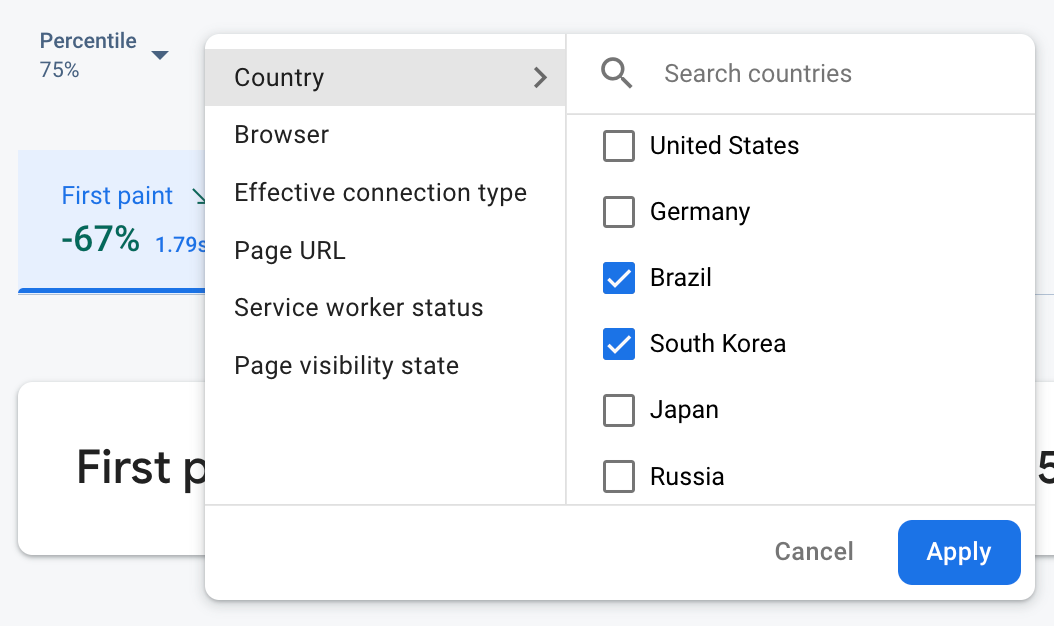
 Filteradd (בפינה הימנית העליונה של המסך) כדי לסנן את הנתונים לפי מאפיין, למשל:
נתונים ממעקב אחרי ביצועים ב-Firebase שמסוננים לפי מאפיין" />
מסננים לפי כתובת URL של דף כדי לראות נתונים של דף ספציפי באתר
מסננים לפי סוג החיבור בפועל כדי לראות איך חיבור 3G
משפיע על האפליקציה
מסננים לפי מדינה כדי לוודא שהמיקום של מסד הנתונים לא משפיע על אזור מסוים.
מאפייני ברירת מחדל
Performance Monitoring אוסף באופן אוטומטי מגוון מאפייני ברירת מחדל בהתאם לסוג העקבות.
כדי להשתמש במאפיינים מותאמים אישית, צריך להוסיף לאפליקציה קוד שמגדיר את המאפיין ומקשר אותו למעקב ספציפי של קוד מותאם אישית. אפשר להגדיר את המאפיין המותאם אישית בכל שלב בין תחילת המעקב לסיום המעקב.
שימו לב לנקודות הבאות:
השמות של מאפיינים מותאמים אישית צריכים לעמוד בדרישות הבאות:
ללא רווחים מובילים או נגררים, ללא תו קו תחתון מוביל (_)
אין מרחבים
האורך המקסימלי הוא 32 תווים
התווים המותרים בשם הם A-Z, a-z ו-_.
כל מעקב אחר קוד בהתאמה אישית יכול לתעד עד 5 מאפיינים בהתאמה אישית.
חשוב לוודא שהמאפיינים המותאמים אישית לא מכילים מידע שמזהה באופן אישי אדם כלשהו עבור Google.
[[["התוכן קל להבנה","easyToUnderstand","thumb-up"],["התוכן עזר לי לפתור בעיה","solvedMyProblem","thumb-up"],["סיבה אחרת","otherUp","thumb-up"]],[["חסרים לי מידע או פרטים","missingTheInformationINeed","thumb-down"],["התוכן מורכב מדי או עם יותר מדי שלבים","tooComplicatedTooManySteps","thumb-down"],["התוכן לא עדכני","outOfDate","thumb-down"],["בעיה בתרגום","translationIssue","thumb-down"],["בעיה בדוגמאות/בקוד","samplesCodeIssue","thumb-down"],["סיבה אחרת","otherDown","thumb-down"]],["עדכון אחרון: 2025-09-05 (שעון UTC)."],[],[],null,["\u003cbr /\u003e\n\niOS+ Android Web \n\n\u003cbr /\u003e\n\nWith Performance Monitoring, you can use attributes to segment performance data and focus\non your app's performance in different real-world scenarios.\n\nAfter you click a trace name in the traces table (located at the bottom of\nthe\n[*Performance* dashboard](//console.firebase.google.com/project/_/performance)), you can drill down into\nmetrics of interest. Use the\n**Filteradd** button\n(top-left of the screen) to filter the data by attribute, for example:\n\nFirebase Performance Monitoring data being filtered by attribute\" /\\\u003e\n\n- Filter by *App version* to view data about a past release or your latest release\n- Filter by *Device* to learn how older devices handle your app\n- Filter by *Country* to make sure your database location isn't affecting a specific region\n\nFor even more powerful analysis based on attributes,\n[export your performance data to BigQuery](/docs/perf-mon/bigquery-export).\n\nDefault attributes\n\nPerformance Monitoring automatically collects a variety of default attributes depending\non the type of trace.\n\nIn addition to these default attributes, you can also\n[create custom attributes](#create-custom-attributes) on your\n[custom code traces](/docs/perf-mon/custom-code-traces) to segment data by\ncategories specific to your app. For example, in a game, you can segment data by\ngame level.\n\nDefault attributes for Apple and Android apps\n\nAll traces for Apple and Android apps collect the following attributes by default:\n\n- App version\n- Country\n- OS level\n- Device\n- Radio\n- Carrier\n\nIn addition, network request traces also collect the following attribute:\n\n- MIME type\n\nCollecting user data **Collecting user data:** Performance Monitoring does not itself collect\n| any personally identifiable information (PII), such as names, email\n| addresses, or phone numbers. Developers can collect additional data using\n| Performance Monitoring by creating custom attributes on custom code traces. Such data collected through\n| Performance Monitoring should not contain information that personally identifies an\n| individual to Google.\n|\n| Here's an example of a log message that *does not* contain\n| personally identifiable information: \n|\n| ```java\n| trace.putAttribute(\"experiment\", \"A\");\n| ```\n|\n| Here's an example that *does* contain personally\n| identifiable information (***do not use*** this type of\n| custom attribute in your app): \n|\n| ```java\n| trace.putAttribute(\"email\", user.getEmailAddress());\n| ```\n|\n| Data that exposes any personally identifiable information is subject to\n| deletion without notice.\n\nCreate custom attributes\n\nYou can create custom attributes on any of your instrumented\n[custom code traces](/docs/perf-mon/custom-code-traces).\n\nUse the Performance Monitoring Trace API\n([Swift](/docs/reference/swift/firebaseperformance/api/reference/Classes/Trace)\n\\|\n[Obj-C](/docs/reference/ios/firebaseperformance/api/reference/Classes/FIRTrace))\nto add custom attributes to custom code traces.\n\nTo use custom attributes, add code to your app that defines the attribute and\nassociates it with a specific custom code trace. You can set the custom\nattribute anytime between when the trace starts and when the trace stops.\n\nNote the following:\n\n- Names for custom attributes must meet the following requirements:\n\n - No leading or trailing whitespace, no leading underscore (`_`) character\n - No spaces\n - Max length is 32 characters\n - Allowed characters for the name are `A-Z`, `a-z`, and `_`.\n- Each custom code trace can record up to 5 custom attributes.\n\n- Please ensure that custom attributes do not contain any information that\n personally identifies an individual to Google.\n\n Learn more about this guideline\n | **Collecting user data:** Performance Monitoring does not itself collect\n | any personally identifiable information (PII), such as names, email\n | addresses, or phone numbers. Developers can collect additional data using\n | Performance Monitoring by creating custom attributes on custom code traces. Such data collected through\n | Performance Monitoring should not contain information that personally identifies an\n | individual to Google.\n |\n | Here's an example of a log message that *does not* contain\n | personally identifiable information: \n |\n | ```java\n | trace.putAttribute(\"experiment\", \"A\");\n | ```\n |\n | Here's an example that *does* contain personally\n | identifiable information (***do not use*** this type of\n | custom attribute in your app): \n |\n | ```java\n | trace.putAttribute(\"email\", user.getEmailAddress());\n | ```\n |\n | Data that exposes any personally identifiable information is subject to\n | deletion without notice.\n\nSwift\n\n\n**Note:** This Firebase product is not available on macOS, Mac Catalyst, watchOS targets. \n\n```swift\nlet trace = Performance.startTrace(name: \"\u003cvar class=\"readonly\" translate=\"no\"\u003eCUSTOM_TRACE_NAME\u003c/var\u003e\")\n\ntrace.setValue(\"A\", forAttribute: \"experiment\")\n\n// Update scenario.\ntrace.setValue(\"B\", forAttribute: \"experiment\")\n\n// Reading scenario.\nlet experimentValue:String? = trace.valueForAttribute(\"experiment\")\n\n// Delete scenario.\ntrace.removeAttribute(\"experiment\")\n\n// Read attributes.\nlet attributes:[String, String] = trace.attributes;\n```\n\nObjective-C\n\n\n**Note:** This Firebase product is not available on macOS, Mac Catalyst, watchOS targets. \n\n```objective-c\nFIRTrace *trace = [FIRPerformance startTraceWithName:@\"\u003cvar class=\"readonly\" translate=\"no\"\u003eCUSTOM_TRACE_NAME\u003c/var\u003e\"];\n\n[trace setValue:@\"A\" forAttribute:@\"experiment\"];\n\n// Update scenario.\n[trace setValue:@\"B\" forAttribute:@\"experiment\"];\n\n// Reading scenario.\nNSString *experimentValue = [trace valueForAttribute:@\"experiment\"];\n\n// Delete scenario.\n[trace removeAttribute:@\"experiment\"];\n\n// Read attributes.\nNSDictionary \u003cNSString *, NSString *\u003e *attributes = [trace attributes];\n```"]]