

Performance Monitoring ردیابیهایی را جمعآوری میکند تا به شما در نظارت بر عملکرد برنامهتان کمک کند. ردیابی، گزارشی از دادههای عملکرد است که بین دو نقطه زمانی در برنامه شما ثبت میشود.
شما میتوانید ردیابیهای خودتان را برای نظارت بر دادههای عملکرد مرتبط با کد خاصی در برنامهتان ایجاد کنید. با ردیابی کد سفارشی ، میتوانید مدت زمان لازم برای تکمیل یک کار خاص یا مجموعهای از کارها توسط برنامهتان، مثلاً بارگذاری مجموعهای از تصاویر یا پرسوجو از پایگاه دادهتان را اندازهگیری کنید.
معیار پیشفرض برای ردیابی کد سفارشی، «مدت زمان» آن (زمان بین نقاط شروع و پایان ردیابی) است، اما میتوانید معیارهای سفارشی نیز اضافه کنید.
در کد خود، ابتدا و انتهای یک ردیابی کد سفارشی را با استفاده از APIهای ارائه شده توسط Performance Monitoring SDK تعریف میکنید.ردیابی کدهای سفارشی را میتوان در هر زمانی پس از ایجاد آنها آغاز کرد و از نظر thread safe هستند.
از آنجایی که معیار پیشفرض جمعآوریشده برای این ردپاها «مدت زمان» است، گاهی اوقات به آنها «ردپاهای مدت زمان» نیز گفته میشود.
میتوانید دادههای این ردها را در زیربرگه ردهای سفارشی از جدول ردها، که در پایین داشبورد عملکرد قرار دارد، مشاهده کنید (در ادامه این صفحه درباره استفاده از کنسول بیشتر بدانید).
ویژگیهای پیشفرض، ویژگیهای سفارشی و معیارهای سفارشی
برای ردیابی کدهای سفارشی، Performance Monitoring به طور خودکار ویژگیهای پیشفرض (فرادادههای رایج مانند نسخه برنامه، کشور، دستگاه و غیره) را ثبت میکند تا بتوانید دادهها را برای ردیابی در کنسول Firebase فیلتر کنید. همچنین میتوانید ویژگیهای سفارشی (مانند سطح بازی یا ویژگیهای کاربر) را اضافه و نظارت کنید.شما میتوانید یک ردیابی کد سفارشی را برای ثبت معیارهای سفارشی برای رویدادهای مرتبط با عملکرد که در محدوده ردیابی رخ میدهند، پیکربندی کنید. به عنوان مثال، میتوانید یک معیار سفارشی برای تعداد موفقیتها و شکستهای حافظه پنهان یا تعداد دفعاتی که رابط کاربری برای یک دوره زمانی قابل توجه پاسخگو نیست، ایجاد کنید.
ویژگیهای سفارشی و معیارهای سفارشی در کنسول Firebase در کنار ویژگیهای پیشفرض و معیارهای پیشفرض برای ردیابی نمایش داده میشوند.
اضافه کردن رد کدهای سفارشی
از API ردیابی Performance Monitoring ( Swift | Obj-C ) برای اضافه کردن ردیابیهای کد سفارشی جهت نظارت بر کد خاص برنامه استفاده کنید.
به موارد زیر توجه کنید:
- یک برنامه میتواند چندین رد کد سفارشی داشته باشد.
- بیش از یک ردیابی کد سفارشی میتواند همزمان اجرا شود.
- نامهای مربوط به ردیابی کدهای سفارشی باید الزامات زیر را داشته باشند: بدون فاصلهی خالی در ابتدا یا انتهای نام، بدون کاراکتر زیرخط (
_) در ابتدای نام، و حداکثر طول ۱۰۰ کاراکتر. - ردیابی کدهای سفارشی از اضافه کردن معیارها و ویژگیهای سفارشی پشتیبانی میکند.
برای شروع و توقف ردیابی کد سفارشی، کدی را که میخواهید ردیابی کنید، با خطوط کدی مشابه موارد زیر بپوشانید:
سویفت
// Add the Performance Monitoring module to your header
import FirebasePerformance

let trace = Performance.startTrace(name: "CUSTOM_TRACE_NAME")

// code that you want to trace

trace.stop()
هدف-سی
// Add the Performance Monitoring module to your header
@import FirebasePerformance;

FIRTrace *trace = [FIRPerformance startTraceWithName:@"CUSTOM_TRACE_NAME"];

// code that you want to trace

[trace stop];
معیارهای سفارشی را به ردیابیهای کد سفارشی اضافه کنید
از رابط برنامهنویسی کاربردی ردیابی Performance Monitoring ( Swift | Obj-C ) برای افزودن معیارهای سفارشی به ردیابیهای کد سفارشی استفاده کنید.
به موارد زیر توجه کنید:
- نامهای معیارهای سفارشی باید الزامات زیر را داشته باشند: بدون فاصلهی خالی در ابتدا یا انتهای نام، بدون کاراکتر زیرخط (
_) در ابتدای نام، و حداکثر طول ۱۰۰ کاراکتر. - هر ردیابی کد سفارشی میتواند تا ۳۲ معیار (از جمله معیار پیشفرض مدت زمان ) را ثبت کند.
برای افزودن یک معیار سفارشی، هر بار که رویداد رخ میدهد، یک خط کد مشابه زیر اضافه کنید. برای مثال، این معیار سفارشی، رویدادهای مرتبط با عملکرد را که در برنامه شما رخ میدهند، مانند بازدیدهای حافظه پنهان یا تلاشهای مجدد، شمارش میکند.
سویفت
let trace = Performance.startTrace(name: "CUSTOM_TRACE_NAME")

trace.incrementMetric("EVENT_NAME", by: 1)
// code that you want to trace (and log custom metrics)

trace.stop()
هدف-سی
FIRTrace *trace = [FIRPerformance startTraceWithName:@"CUSTOM_TRACE_NAME"];

[trace incrementMetric:@"EVENT_NAME" byInt:1];
// code that you want to trace (and log custom metrics)

[trace stop];
ایجاد ویژگیهای سفارشی برای ردیابی کدهای سفارشی
از API ردیابی Performance Monitoring ( Swift | Obj-C ) برای افزودن ویژگیهای سفارشی به ردیابیهای کد سفارشی استفاده کنید.
برای استفاده از ویژگیهای سفارشی، کدی را به برنامه خود اضافه کنید که ویژگی را تعریف میکند و آن را با یک ردیابی کد سفارشی خاص مرتبط میکند. میتوانید ویژگی سفارشی را در هر زمانی بین شروع ردیابی و پایان ردیابی تنظیم کنید.
به موارد زیر توجه کنید:
نامهای مربوط به ویژگیهای سفارشی باید شرایط زیر را داشته باشند:
- بدون فاصلهی خالی در ابتدا یا انتهای کاراکتر، بدون کاراکتر زیرخط (
_) در ابتدای کاراکتر - بدون فاصله
- حداکثر طول ۳۲ کاراکتر است
- کاراکترهای مجاز برای نام عبارتند از
AZ،azو_.
- بدون فاصلهی خالی در ابتدا یا انتهای کاراکتر، بدون کاراکتر زیرخط (
هر ردیابی کد سفارشی میتواند تا ۵ ویژگی سفارشی را ثبت کند.
لطفاً مطمئن شوید که ویژگیهای سفارشی حاوی هیچ اطلاعاتی نیستند که هویت شخصی را برای گوگل مشخص کند.
درباره این دستورالعمل بیشتر بدانید
سویفت
let trace = Performance.startTrace(name: "CUSTOM_TRACE_NAME")

trace.setValue("A", forAttribute: "experiment")

// Update scenario.
trace.setValue("B", forAttribute: "experiment")

// Reading scenario.
let experimentValue:String? = trace.valueForAttribute("experiment")

// Delete scenario.
trace.removeAttribute("experiment")

// Read attributes.
let attributes:[String, String] = trace.attributes;
هدف-سی
FIRTrace *trace = [FIRPerformance startTraceWithName:@"CUSTOM_TRACE_NAME"];

[trace setValue:@"A" forAttribute:@"experiment"];

// Update scenario.
[trace setValue:@"B" forAttribute:@"experiment"];

// Reading scenario.
NSString *experimentValue = [trace valueForAttribute:@"experiment"];

// Delete scenario.
[trace removeAttribute:@"experiment"];

// Read attributes.
NSDictionary <NSString *, NSString *> *attributes = [trace attributes];
ردیابی، مشاهده و فیلتر کردن دادههای عملکرد
معیارهای خاص را در داشبورد خود پیگیری کنید
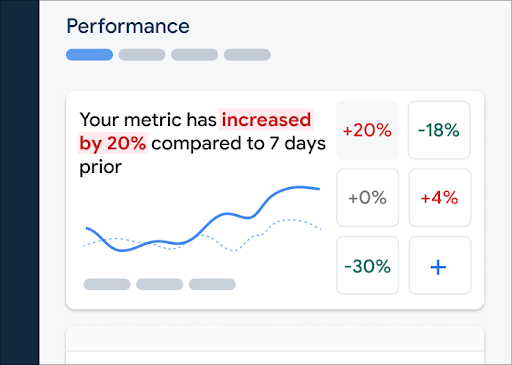
برای اطلاع از روند تغییرات معیارهای کلیدی خود، آنها را به تابلوی معیارهای خود در بالای داشبورد عملکرد اضافه کنید. میتوانید با مشاهده تغییرات هفته به هفته، به سرعت رگرسیونها را شناسایی کنید یا تأیید کنید که تغییرات اخیر در کد شما باعث بهبود عملکرد میشوند.
 داشبورد نظارت بر عملکرد فایربیس" />
برای اضافه کردن یک معیار به جدول معیارهای خود، این مراحل را دنبال کنید:
- به داشبورد Performance در کنسول Firebase بروید.
- روی یک کارت معیار خالی کلیک کنید، سپس یک معیار موجود را برای اضافه کردن به صفحه خود انتخاب کنید.
- برای گزینههای بیشتر، مثلاً برای جایگزینی یا حذف یک معیار، روی روی یک کارت معیار پر شده کلیک کنید.
صفحه معیارها، دادههای معیار جمعآوریشده را در طول زمان، هم به صورت گرافیکی و هم به صورت درصد تغییر عددی، نشان میدهد.
درباره استفاده از داشبورد بیشتر بدانید.
مشاهده ردپاها و دادههای آنها
برای مشاهدهی ردپاهای خود، به داشبورد Performance در کنسول Firebase بروید، به پایین صفحه بروید تا به جدول ردپاها برسید، سپس روی زیربرگهی مربوطه کلیک کنید. جدول، برخی از معیارهای برتر را برای هر ردپا نمایش میدهد و حتی میتوانید لیست را بر اساس درصد تغییر برای یک معیار خاص مرتب کنید.
Performance Monitoring یک صفحه عیبیابی در کنسول Firebase ارائه میدهد که تغییرات معیارها را برجسته میکند و رسیدگی سریع و به حداقل رساندن تأثیر مشکلات عملکرد بر برنامهها و کاربران شما را آسان میکند. میتوانید از صفحه عیبیابی هنگام اطلاع از مشکلات عملکرد بالقوه، به عنوان مثال، در سناریوهای زیر استفاده کنید:
- شما معیارهای مرتبط را در داشبورد انتخاب میکنید و متوجه یک اختلاف بزرگ میشوید.
- در جدول ردپاها، شما مرتبسازی را طوری انجام میدهید که بزرگترین دلتاها در بالا نمایش داده شوند و تغییر درصد قابل توجهی را مشاهده خواهید کرد.
- شما یک هشدار ایمیلی دریافت میکنید که شما را از یک مشکل عملکردی مطلع میکند.
شما میتوانید از طریق روشهای زیر به صفحه رفع مشکلات دسترسی پیدا کنید:
- در داشبورد معیار، روی دکمه مشاهده جزئیات معیار کلیک کنید.
- روی هر کارت متریک، انتخاب کنید
=> مشاهده جزئیات . صفحه عیبیابی اطلاعات مربوط به معیار انتخابی شما را نمایش میدهد. - در جدول ردها، روی نام رد یا هر مقدار معیار در ردیف مرتبط با آن رد کلیک کنید.
- در هشدار ایمیلی، روی «اکنون بررسی کنید» کلیک کنید.
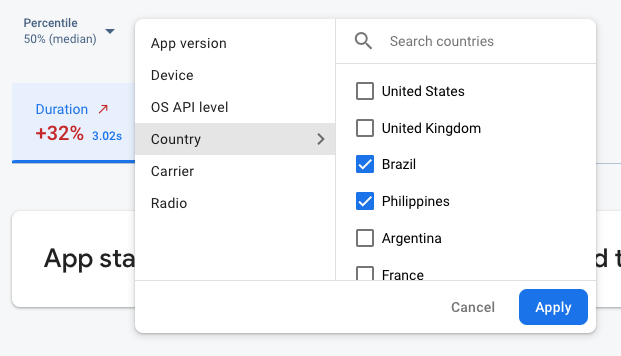
وقتی روی نام یک رد در جدول ردها کلیک میکنید، میتوانید معیارهای مورد علاقه خود را بررسی کنید. روی
 دادههای نظارت بر عملکرد Firebase بر اساس ویژگی فیلتر میشوند" />
- برای مشاهده اطلاعات مربوط به نسخه قبلی یا آخرین نسخه، بر اساس نسخه برنامه فیلتر کنید
- برای اطلاع از نحوه مدیریت برنامه توسط دستگاههای قدیمیتر، آن را بر اساس دستگاه فیلتر کنید
- بر اساس کشور فیلتر کنید تا مطمئن شوید موقعیت مکانی پایگاه داده شما بر منطقه خاصی تأثیر نمیگذارد
درباره مشاهده دادههای ردپاهایتان بیشتر بدانید.
مراحل بعدی
درباره استفاده از ویژگیها برای بررسی دادههای عملکرد بیشتر بدانید.
درباره نحوه ردیابی مشکلات عملکرد در کنسول Firebase بیشتر بدانید.
برای تغییرات کدی که عملکرد برنامه شما را کاهش میدهند، هشدار تنظیم کنید . به عنوان مثال، میتوانید یک هشدار ایمیلی برای تیم خود پیکربندی کنید اگر مدت زمان ردیابی یک کد سفارشی خاص از آستانهای که تعیین کردهاید فراتر رود.
- گزارشهای دقیقی از جلسات کاربر مشاهده کنید که در آن میتوانید یک ردپای خاص را در یک چارچوب زمانی از سایر ردپاهای جمعآوریشده در همان جلسه مشاهده کنید.
Performance Monitoring ردیابیهایی را جمعآوری میکند تا به شما در نظارت بر عملکرد برنامهتان کمک کند. ردیابی، گزارشی از دادههای عملکرد است که بین دو نقطه زمانی در برنامه شما ثبت میشود.
شما میتوانید ردیابیهای خودتان را برای نظارت بر دادههای عملکرد مرتبط با کد خاصی در برنامهتان ایجاد کنید. با ردیابی کد سفارشی ، میتوانید مدت زمان لازم برای تکمیل یک کار خاص یا مجموعهای از کارها توسط برنامهتان، مثلاً بارگذاری مجموعهای از تصاویر یا پرسوجو از پایگاه دادهتان را اندازهگیری کنید.
معیار پیشفرض برای ردیابی کد سفارشی، «مدت زمان» آن (زمان بین نقاط شروع و پایان ردیابی) است، اما میتوانید معیارهای سفارشی نیز اضافه کنید.
In your code, you define the beginning and the end of a custom code trace using the APIs provided by the Performance Monitoring SDK.Custom code traces can be started anytime after they've been created, and they are thread safe.
Since the default metric collected for these traces is "duration", they are sometimes called "Duration traces".
You can view data from these traces in the Custom traces subtab of the traces table, which is at the bottom of the Performance dashboard (learn more about using the console later on this page).
Default attributes, custom attributes, and custom metrics
For custom code traces, Performance Monitoring automatically logs default attributes (common metadata like app version, country, device, etc.) so that you can filter the data for the trace in the Firebase console. You can also add and monitor custom attributes (such as, game level or user properties).You can further configure a custom code trace to record custom metrics for performance-related events that occur within the trace's scope. For example, you can create a custom metric for the number of cache hits and misses or the number of times that the UI becomes unresponsive for a noticeable period of time.
Custom attributes and custom metrics display in the Firebase console alongside the default attributes and default metric for the trace.
Add custom code traces
Use the Performance Monitoring Trace API ( Swift | Obj-C ) to add custom code traces to monitor specific application code.
Note the following:
- An app can have multiple custom code traces.
- More than one custom code trace can run at the same time.
- Names for custom code traces must meet the following requirements: no leading or trailing whitespace, no leading underscore (
_) character, and max length is 100 characters. - Custom code traces support adding custom metrics and custom attributes .
To start and stop a custom code trace, wrap the code that you want to trace with lines of code similar to the following:
سویفت
// Add the Performance Monitoring module to your header
import FirebasePerformance

let trace = Performance.startTrace(name: "CUSTOM_TRACE_NAME")

// code that you want to trace

trace.stop()
هدف-سی
// Add the Performance Monitoring module to your header
@import FirebasePerformance;

FIRTrace *trace = [FIRPerformance startTraceWithName:@"CUSTOM_TRACE_NAME"];

// code that you want to trace

[trace stop];
Add custom metrics to custom code traces
Use the Performance Monitoring Trace API ( Swift | Obj-C ) to add custom metrics to custom code traces.
Note the following:
- Names for custom metrics must meet the following requirements: no leading or trailing whitespace, no leading underscore (
_) character, and max length is 100 characters. - Each custom code trace can record up to 32 metrics (including the default Duration metric).
To add a custom metric, add a line of code similar to the following each time that the event occurs. For example, this custom metric counts performance- related events that occur in your app, such as cache hits or retries.
سویفت
let trace = Performance.startTrace(name: "CUSTOM_TRACE_NAME")

trace.incrementMetric("EVENT_NAME", by: 1)
// code that you want to trace (and log custom metrics)

trace.stop()
هدف-سی
FIRTrace *trace = [FIRPerformance startTraceWithName:@"CUSTOM_TRACE_NAME"];

[trace incrementMetric:@"EVENT_NAME" byInt:1];
// code that you want to trace (and log custom metrics)

[trace stop];
Create custom attributes for custom code traces
Use the Performance Monitoring Trace API ( Swift | Obj-C ) to add custom attributes to custom code traces.
To use custom attributes, add code to your app that defines the attribute and associates it with a specific custom code trace. You can set the custom attribute anytime between when the trace starts and when the trace stops.
Note the following:
Names for custom attributes must meet the following requirements:
- No leading or trailing whitespace, no leading underscore (
_) character - بدون فاصله
- Max length is 32 characters
- Allowed characters for the name are
AZ,az, and_.
- No leading or trailing whitespace, no leading underscore (
Each custom code trace can record up to 5 custom attributes.
Please ensure that custom attributes do not contain any information that personally identifies an individual to Google.
Learn more about this guideline
سویفت
let trace = Performance.startTrace(name: "CUSTOM_TRACE_NAME")

trace.setValue("A", forAttribute: "experiment")

// Update scenario.
trace.setValue("B", forAttribute: "experiment")

// Reading scenario.
let experimentValue:String? = trace.valueForAttribute("experiment")

// Delete scenario.
trace.removeAttribute("experiment")

// Read attributes.
let attributes:[String, String] = trace.attributes;
هدف-سی
FIRTrace *trace = [FIRPerformance startTraceWithName:@"CUSTOM_TRACE_NAME"];

[trace setValue:@"A" forAttribute:@"experiment"];

// Update scenario.
[trace setValue:@"B" forAttribute:@"experiment"];

// Reading scenario.
NSString *experimentValue = [trace valueForAttribute:@"experiment"];

// Delete scenario.
[trace removeAttribute:@"experiment"];

// Read attributes.
NSDictionary <NSString *, NSString *> *attributes = [trace attributes];
Track, view, and filter performance data
Track specific metrics in your dashboard
To learn how your key metrics are trending, add them to your metrics board at the top of the Performance dashboard. You can quickly identify regressions by seeing week-over-week changes or verify that recent changes in your code are improving performance.
Firebase Performance Monitoring dashboard" />To add a metric to your metrics board, follow these steps:
- Go to the Performance dashboard in the Firebase console.
- Click an empty metric card, then select an existing metric to add to your board.
- Click on a populated metric card for more options, for example to replace or remove a metric.
The metrics board shows collected metric data over time, both in graphical form and as a numerical percentage change.
Learn more about using the dashboard .
View traces and their data
To view your traces, go to the Performance dashboard in the Firebase console, scroll down to the traces table, then click the appropriate subtab. The table displays some top metrics for each trace, and you can even sort the list by the percentage change for a specific metric.
Performance Monitoring provides a troubleshooting page in the Firebase console that highlights metric changes, making it easy to quickly address and minimize the impact of performance issues on your apps and users. You can use the troubleshooting page when you learn about potential performance issues, for example, in the following scenarios:
- You select relevant metrics on the dashboard and you notice a big delta.
- In the traces table you sort to display the largest deltas at the top, and you see a significant percentage change.
- You receive an email alert notifying you of a performance issue.
You can access the troubleshooting page in the following ways:
- On the metric dashboard, click the View metric details button.
- On any metric card, select
=> View details . The troubleshooting page displays information about the metric you selected. - In the traces table, click a trace name or any metric value in the row associated with that trace.
- In an email alert, click Investigate now .
When you click a trace name in the traces table, you can then drill down into metrics of interest. Click the
Firebase Performance Monitoring data being filtered by attribute" />- Filter by App version to view data about a past release or your latest release
- Filter by Device to learn how older devices handle your app
- Filter by Country to make sure your database location isn't affecting a specific region
Learn more about viewing data for your traces .
مراحل بعدی
Learn more about using attributes to examine performance data.
Learn more about how to track performance issues in the Firebase console.
Set up alerts for code changes that are degrading the performance of your app. For example, you can configure an email alert for your team if the duration of a specific custom code trace exceeds a threshold that you set.
- View detailed reports of user sessions in which you can see a specific trace in a timeline context of other traces collected during the same session.