DebugView enables you to see the raw event data logged by your app on development devices in near real-time. This is very useful for validation purposes during the instrumentation phase of development and can help you discover errors and mistakes in your Analytics implementation and confirm that all events and user properties are logged correctly.
Enable debug mode
Generally, events logged by your app are batched together over the period of approximately one hour and uploaded together. This approach conserves the battery on end users’ devices and reduces network data usage. However, for the purposes of validating your Analytics implementation (and, in order to view your Analytics in the DebugView report), you can enable debug mode on your development device to upload events with a minimal delay.
iOS+
To enable Analytics debug mode on your development device, specify the following command line argument in Xcode:
-FIRDebugEnabled
This behavior persists until you explicitly disable debug mode by specifying the following command line argument:
-FIRDebugDisabled
You can add these arguments by editing your project's scheme and adding a new entry to "Arguments Passed On Launch".
Android
To enable Analytics debug mode on an Android device, execute the following commands:
adb shell setprop debug.firebase.analytics.app PACKAGE_NAME
This behavior persists until you explicitly disable debug mode by executing the following command:
adb shell setprop debug.firebase.analytics.app .none.
Web
To enable Analytics debug mode in your browser, install the Google Analytics Debugger Chrome extension.
Once installed, enable the extension and refresh the page. From that point on, the extension will log events in your app in debug mode.
You can view events logged in the DebugView in the Firebase console.
Report on event data
Once you enable debug mode on your development devices, navigate to DebugView by selecting the arrow next to StreamView on the top nav of Google Analytics and selecting DebugView.
 Google Analytics and selecting DebugView">
Then, just start using your app to see your app’s events being logged in the DebugView report.
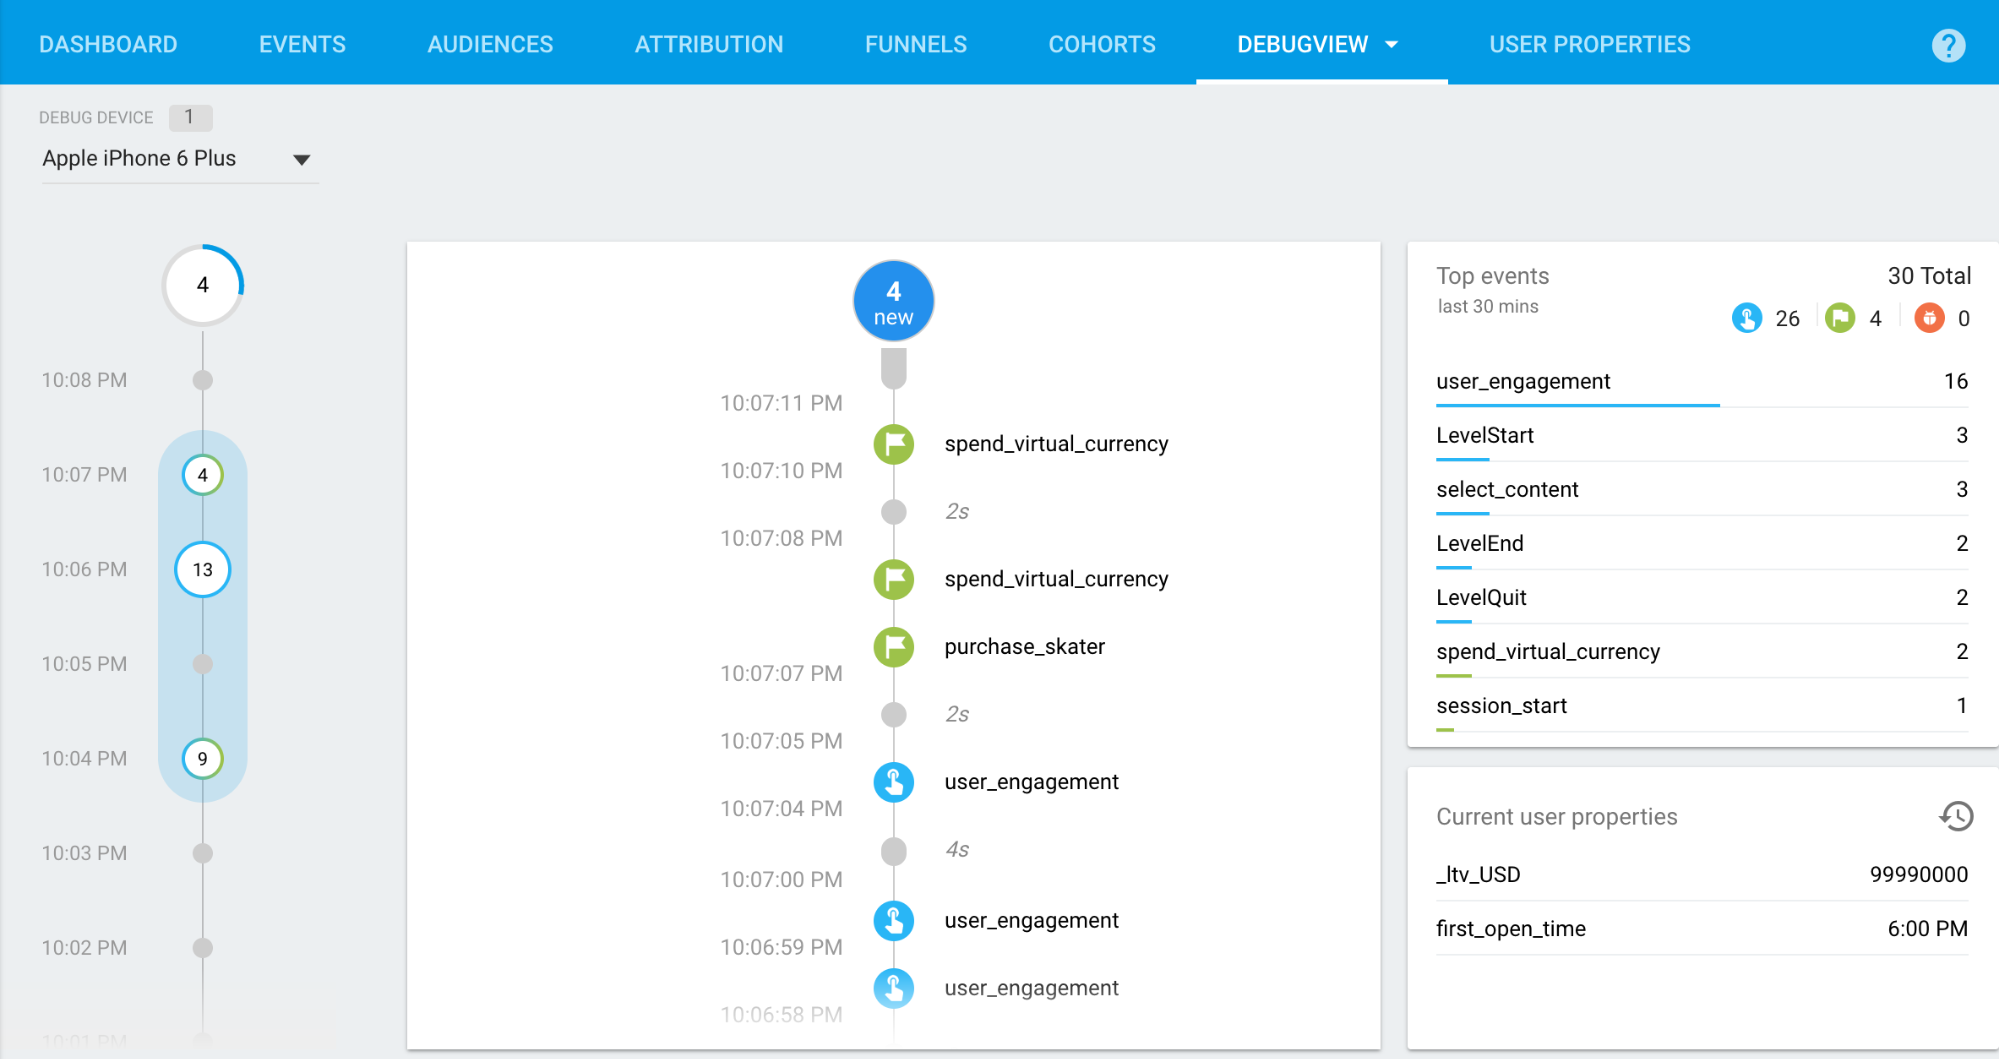
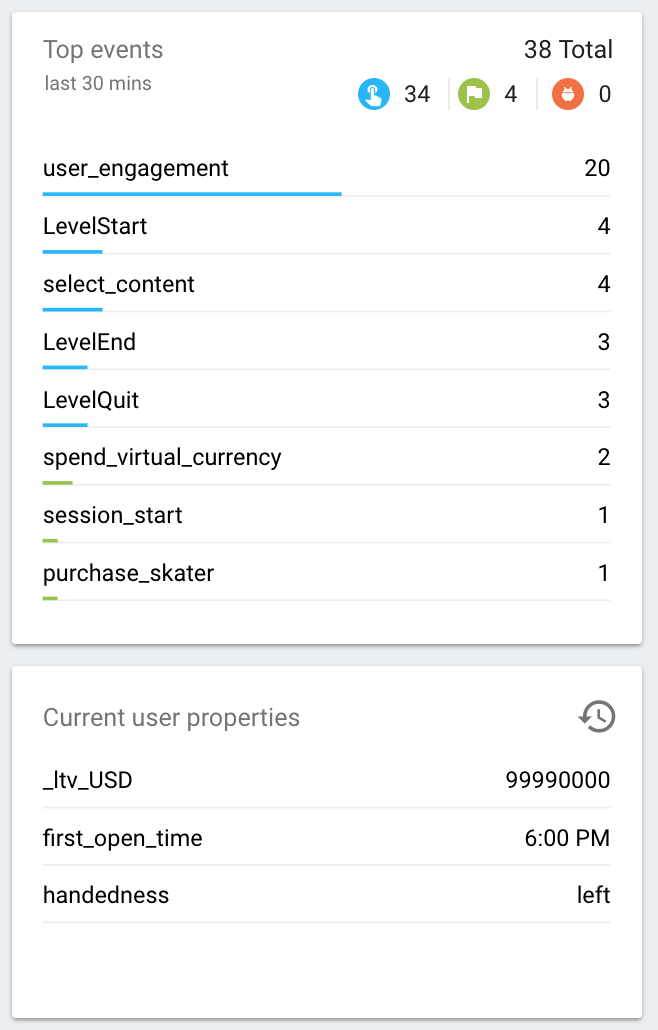
The Seconds stream (the middle column) shows the events which have been logged in the last 60 seconds. The Minutes stream (the left column) shows a series of archives of events over the last 30 minutes. And the right column shows the Top Events logged in the 30-minute period as well as the Current User Properties for the currently selected development device.
Seconds stream
By default, you will see a list of events logged in the last 60 seconds. Each event displays a timestamp that corresponds to the time of its logging on the development device. You can click on an event to see a list of the parameters that were associated with that event.
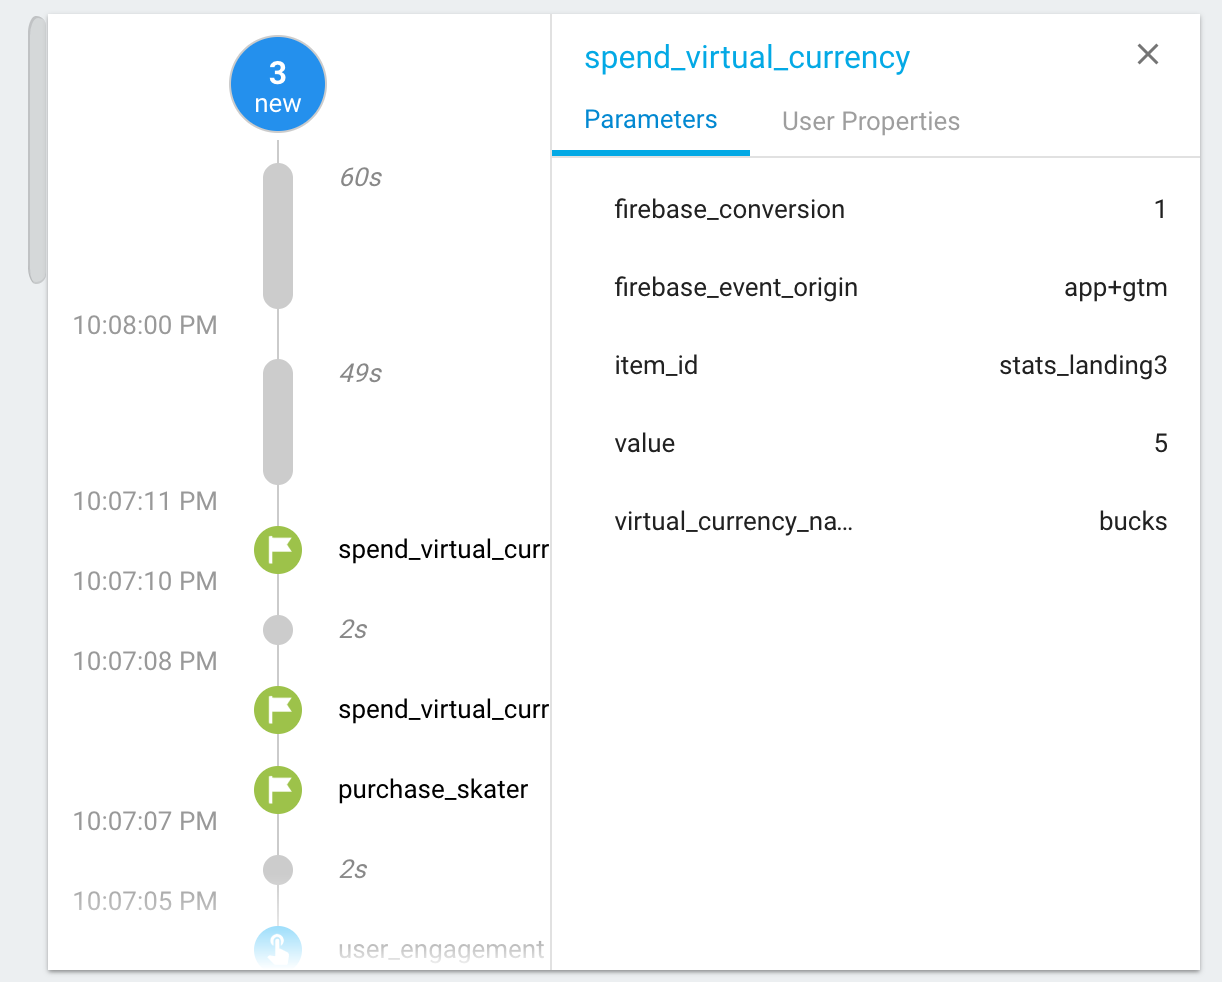
As user property values change during the course of app usage, you will see an entry for that change.

Minutes stream
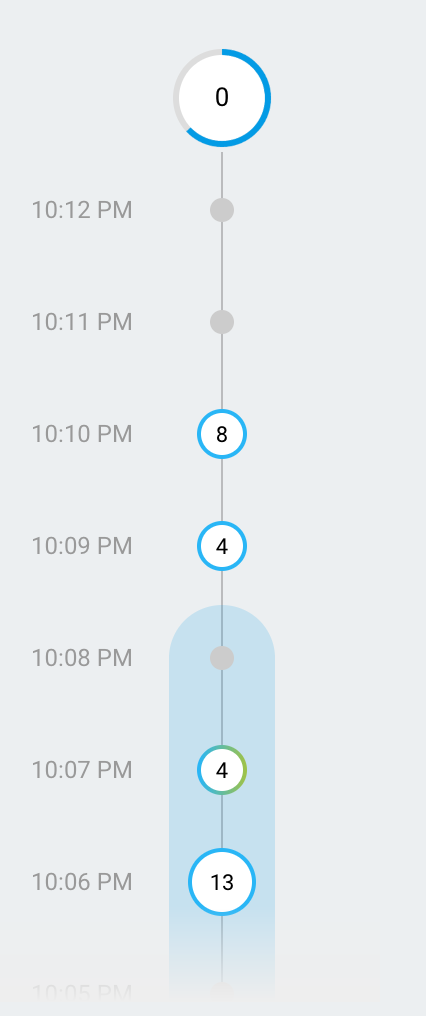
This stream shows a series of circles which each correspond to a minute of time over the last 30 minutes. The number in the circle indicates the count of events received in that minute. Clicking on one of these circles will populate the Seconds stream with events which were logged during that minute of time. This effectively allows you to examine the events logged over the last 30 minutes in fine-grained detail.
Top events and Current User Properties
The Top Events table shows the top events which were logged during the 30-minute period. And the Current User Properties table shows the latest state of the set of User Properties for the currently selected development device.
Device selector
Since many different development devices can have debug mode enabled, you can use the Device selector to choose the specific device on which the DebugView report will focus. This allows multiple developers to focus on their own instrumentation and validation efforts without impacting one another.
