تنظيم صفحاتك في مجموعات
يمكنك حفظ المحتوى وتصنيفه حسب إعداداتك المفضّلة.
تتيح لك أداة DebugView الاطّلاع على بيانات الأحداث الأولية التي يسجّلها تطبيقك على أجهزة التطوير في الوقت الفعلي تقريبًا. ويكون ذلك مفيدًا جدًا لأغراض التحقّق من الصحة خلال مرحلة إعداد أدوات القياس في عملية التطوير، ويمكن أن يساعدك في رصد الأخطاء في عملية تنفيذ Analytics والتأكّد من تسجيل جميع الأحداث وخصائص المستخدمين بشكل صحيح.
تفعيل وضع تصحيح الأخطاء
بشكل عام، يتم تجميع الأحداث التي يسجّلها تطبيقك في حِزم على مدار ساعة واحدة تقريبًا، ثم يتم تحميلها معًا. ويحافظ هذا النهج على
بطارية أجهزة المستخدمين النهائيين ويقلّل من استخدام بيانات الشبكة. ومع ذلك، لأغراض التحقّق من صحة عملية تنفيذ Analytics (ولكي تتمكّن من عرض Analytics في تقرير DebugView)، يمكنك تفعيل وضع تصحيح الأخطاء على جهاز التطوير لتحميل الأحداث بأقل تأخير.
iOS+
لتفعيل وضع تصحيح الأخطاء Analytics على جهاز التطوير، حدِّد وسيطة سطر الأوامر التالية في Xcode:
-FIRDebugEnabled
يستمر أسلوب الأداء هذا إلى أن يتم إيقاف وضع تصحيح الأخطاء بشكل صريح عن طريق تحديد وسيطة سطر الأوامر التالية:
-FIRDebugDisabled
يمكنك إضافة هذه الوسيطات من خلال تعديل مخطط مشروعك وإضافة إدخال جديد إلى "الوسيطات التي تم تمريرها عند التشغيل".
Android
لتفعيل Analytics وضع تصحيح الأخطاء على جهاز Android، نفِّذ الأوامر التالية:
بعد تثبيت الإضافة، فعِّلها وأعِد تحميل الصفحة. ومن تلك اللحظة فصاعدًا، ستسجّل الإضافة الأحداث داخل تطبيقك في وضع تصحيح الأخطاء.
يمكنك عرض الأحداث التي تم تسجيلها في DebugView ضمن وحدة تحكّم Firebase.
تسجيل بيانات الأحداث
بعد تفعيل وضع تصحيح الأخطاء على أجهزة التطوير، انتقِل إلى DebugView من خلال النقر على السهم بجانب StreamView في شريط التنقّل العلوي في Google Analytics، ثم النقر على DebugView.
إحصاءات Google واختيار DebugView">
بعد ذلك، ابدأ استخدام تطبيقك لرؤية أحداث التطبيق التي يتم تسجيلها في تقرير DebugView.
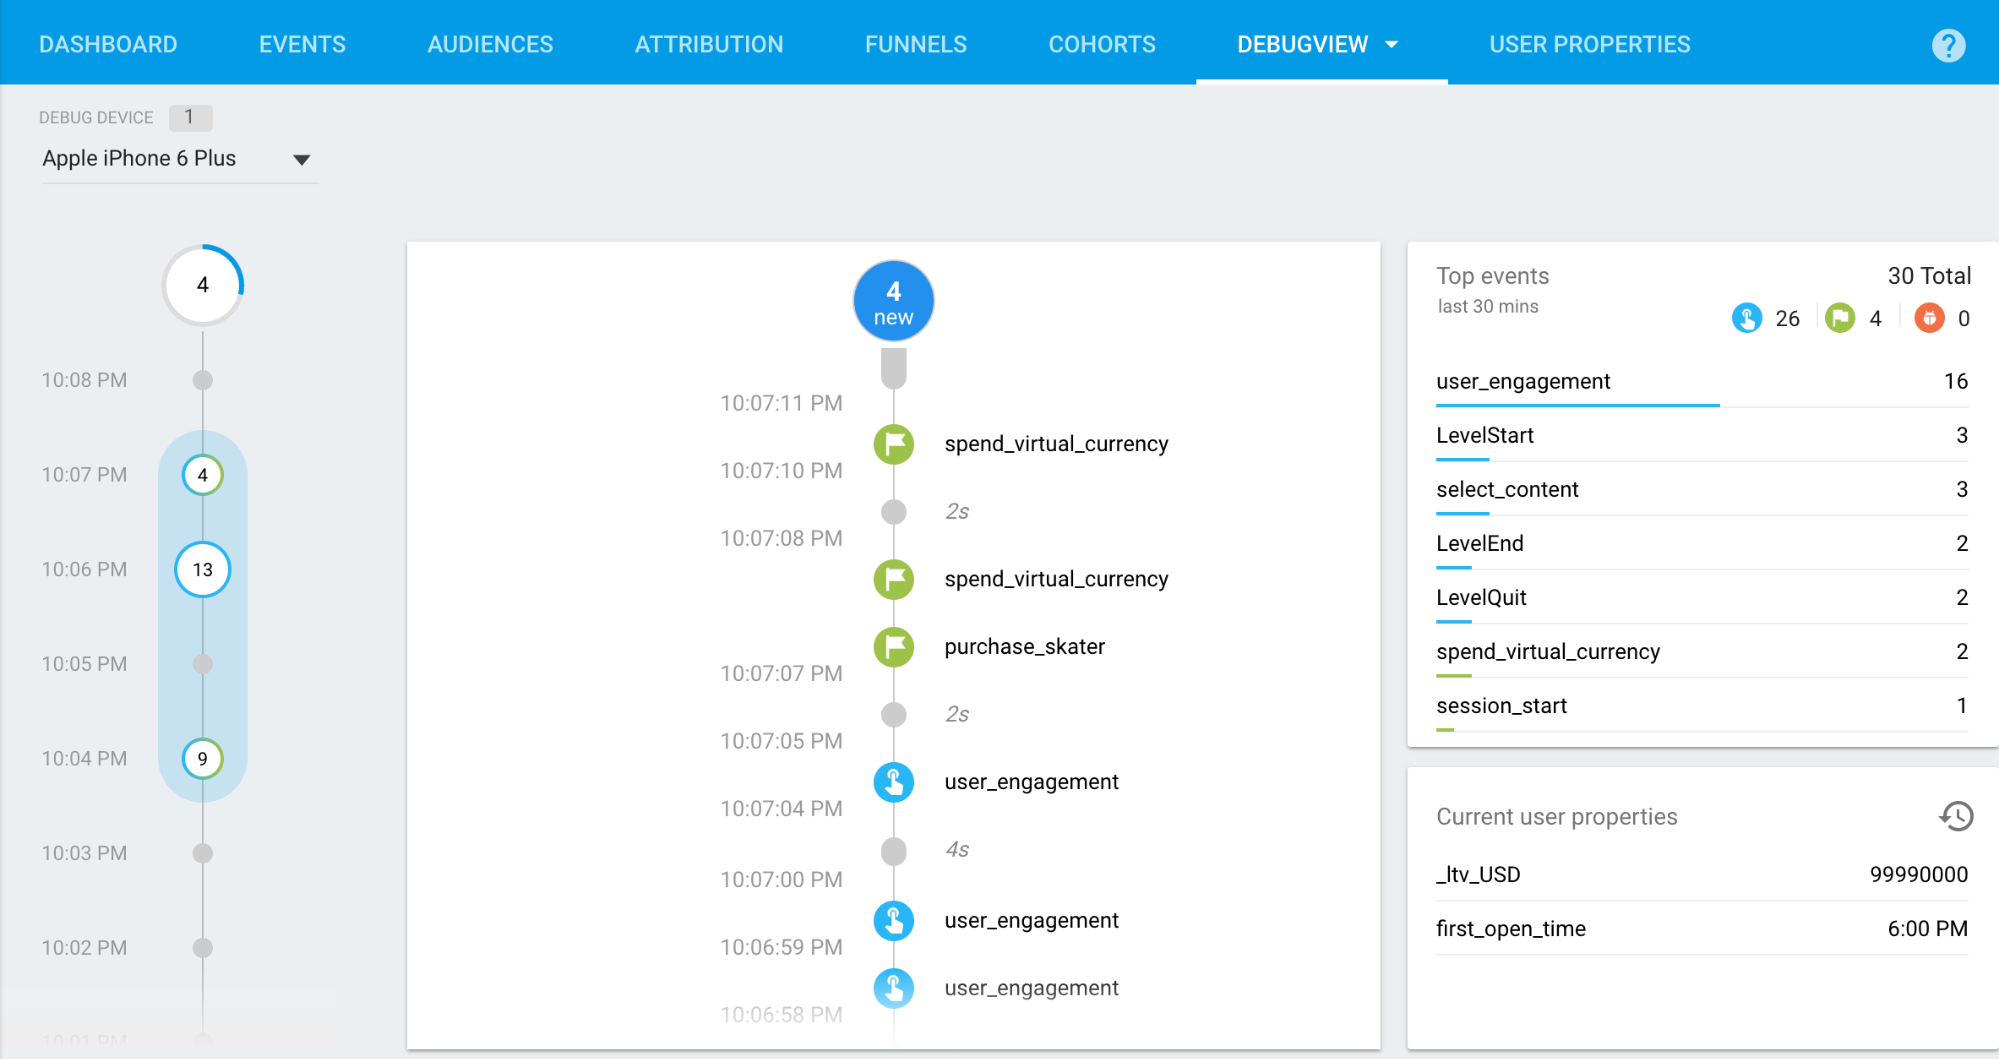
تعرِض سلسلة بطاقات الثواني (العمود الأوسط) الأحداث التي تمّ تسجيلها خلال آخر 60 ثانية. وتعرِض سلسلة بطاقات الدقائق (العمود الأيمن) سلسلة من أرشيفات الأحداث خلال آخر 30 دقيقة. ويعرض العمود الأيسر
أهم الأحداث المسجّلة في فترة الثلاثين دقيقة، بالإضافة إلى خصائص المستخدم الحالي
لجهاز التطوير المحدّد حاليًا.
سلسلة بطاقات الثواني
بشكل افتراضي، ستظهر قائمة بالأحداث التي تم تسجيلها في الثواني الـ 60 الأخيرة. ويعرض كل حدث طابعًا زمنيًا يقابل وقت تسجيله على جهاز التطوير. يمكنك النقر على أحد الأحداث للاطّلاع على قائمة بالمعلَمات المرتبطة بهذا الحدث.
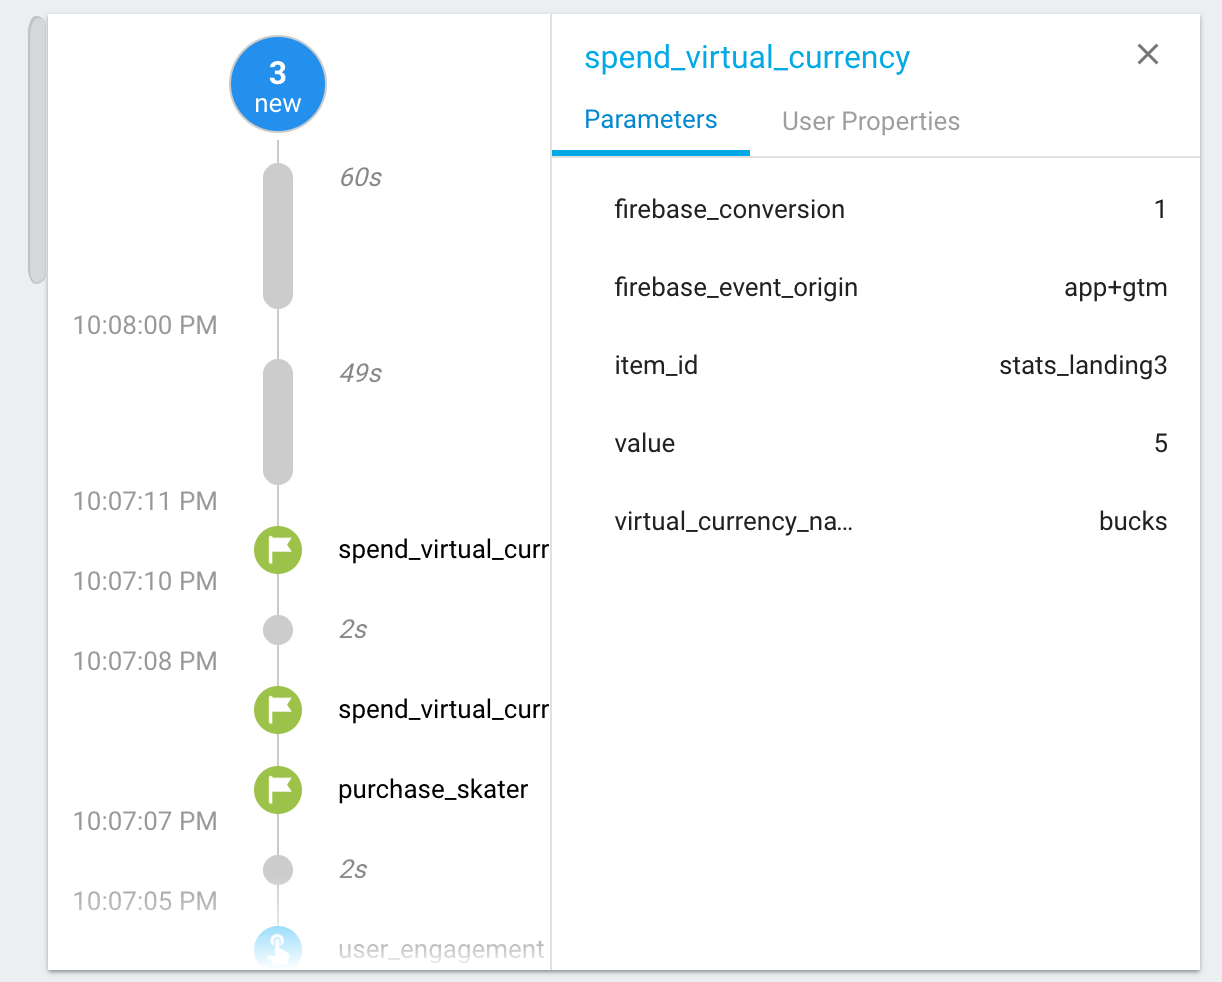
وفي ظل تغير قيم خصائص المستخدمين خلال فترة استخدام التطبيق، سيظهر لك إدخال لهذا التغيير.
سلسلة بطاقات الدقائق
تعرض سلسلة البطاقات هذه سلسلة من الدوائر التي تتوافق كل منها مع دقيقة من الوقت
على مدار آخر 30 دقيقة. ويشير الرقم في الدائرة إلى عدد الأحداث التي تم تلقّيها في تلك الدقيقة. ويؤدي النقر على إحدى هذه الدوائر إلى ملء سلسلة بطاقات الثواني بالأحداث التي تم تسجيلها خلال هذه الدقيقة من الوقت.
يتيح لك ذلك فحص الأحداث التي تم تسجيلها خلال الدقائق الثلاثين الأخيرة بتفاصيل دقيقة وبشكل فعّال.
أهم الأحداث وخصائص المستخدمين الحالية
يعرض جدول "أهم الأحداث" أهم الأحداث التي تم تسجيلها خلال فترة الـ 30 دقيقة. ويعرض جدول "خصائص المستخدمين الحالية" أحدث حالة لمجموعة "خصائص المستخدمين" لجهاز التطوير المحدّد حاليًا.
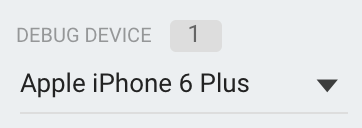
أداة اختيار الأجهزة
نظرًا لإمكانية تفعيل وضع تصحيح الأخطاء على العديد من أجهزة التطوير المختلفة، يمكنك استخدام أداة اختيار الأجهزة لاختيار الجهاز المحدّد الذي سيركّز عليه تقرير DebugView. ويسمح هذا للعديد من مطوّري البرامج بالتركيز على أدواتهم وجهود التحقّق من الصحة بدون تأثير بعضهم في البعض الآخر.
تاريخ التعديل الأخير: 2025-08-31 (حسب التوقيت العالمي المتفَّق عليه)
[[["يسهُل فهم المحتوى.","easyToUnderstand","thumb-up"],["ساعَدني المحتوى في حلّ مشكلتي.","solvedMyProblem","thumb-up"],["غير ذلك","otherUp","thumb-up"]],[["لا يحتوي على المعلومات التي أحتاج إليها.","missingTheInformationINeed","thumb-down"],["الخطوات معقدة للغاية / كثيرة جدًا.","tooComplicatedTooManySteps","thumb-down"],["المحتوى قديم.","outOfDate","thumb-down"],["ثمة مشكلة في الترجمة.","translationIssue","thumb-down"],["مشكلة في العيّنات / التعليمات البرمجية","samplesCodeIssue","thumb-down"],["غير ذلك","otherDown","thumb-down"]],["تاريخ التعديل الأخير: 2025-08-31 (حسب التوقيت العالمي المتفَّق عليه)"],[],[],null,["DebugView enables you to see the raw event data logged by your app on\ndevelopment devices in near real-time. This is very useful for validation\npurposes during the instrumentation phase of development and can help you\ndiscover errors and mistakes in your Analytics implementation and confirm\nthat all events and user properties are logged correctly.\n\nEnable debug mode\n\nGenerally, events logged by your app are batched together over the period of\napproximately one hour and uploaded together. This approach conserves the\nbattery on end users' devices and reduces network data usage. However, for the\npurposes of validating your Analytics implementation (and, in order to\nview your Analytics in the DebugView report), you can enable debug mode\non your development device to upload events with a minimal delay. \n\niOS+\n\nTo enable Analytics debug mode on your development device, specify the\nfollowing command line argument in Xcode: \n\n -FIRDebugEnabled\n\nThis behavior persists until you explicitly disable debug mode by specifying\nthe following command line argument: \n\n -FIRDebugDisabled\n\nYou can add these arguments by editing your project's scheme and adding a\nnew entry to \"Arguments Passed On Launch\".\n\nAndroid\n\nTo enable Analytics debug mode on an Android device,\nexecute the following commands:\n\n\u003cbr /\u003e\n\n```\nadb shell setprop debug.firebase.analytics.app PACKAGE_NAME\n```\n\n\u003cbr /\u003e\n\nThis behavior persists until you explicitly disable debug mode by executing\nthe following command:\n\n\u003cbr /\u003e\n\n```\nadb shell setprop debug.firebase.analytics.app .none.\n```\n\n\u003cbr /\u003e\n\nWeb\n\nTo enable Analytics debug mode in your browser, install the\n[Google Analytics Debugger](https://chrome.google.com/webstore/detail/google-analytics-debugger/jnkmfdileelhofjcijamephohjechhna)\nChrome extension.\n\nOnce installed, enable the extension and refresh the page. From that point\non, the extension will log events in your app in debug mode.\n\nYou can view events logged in the DebugView in the Firebase console.\n| **Note:** To prevent your testing and development from affecting your measurements, events logged while in debug mode will be excluded from your overall Analytics data, and will not be included in your daily BigQuery export.\n\nReport on event data\n\nOnce you enable debug mode on your development devices, navigate to\n[DebugView](//console.firebase.google.com/project/_/analytics/debugview) by selecting the\narrow next to StreamView on the top nav of Google Analytics and\nselecting DebugView.\n\nGoogle Analytics and selecting DebugView\"\\\u003e\n\nThen, just start using your app to see your app's events being logged in the\nDebugView report.\n\nThe Seconds stream (the middle column) shows the events which have been logged\nin the last 60 seconds. The Minutes stream (the left column) shows a series of\narchives of events over the last 30 minutes. And the right column shows the\nTop Events logged in the 30-minute period as well as the Current User Properties\nfor the currently selected development device.\n\nSeconds stream\n\nBy default, you will see a list of events logged in the last 60 seconds. Each\nevent displays a timestamp that corresponds to the time of its logging on the\ndevelopment device. You can click on an event to see a list of the parameters\nthat were associated with that event.\n\nAs user property values change during the course of app usage, you will see an\nentry for that change.\n\nMinutes stream\n\nThis stream shows a series of circles which each correspond to a minute of time\nover the last 30 minutes. The number in the circle indicates the count of\nevents received in that minute. Clicking on one of these circles will populate\nthe Seconds stream with events which were logged during that minute of time.\nThis effectively allows you to examine the events logged over the last 30\nminutes in fine-grained detail.\n\nTop events and Current User Properties\n\nThe Top Events table shows the top events which were logged during the 30-minute\nperiod. And the Current User Properties table shows the latest state of the set\nof User Properties for the currently selected development device.\n\nDevice selector\n\nSince many different development devices can have debug mode enabled, you can\nuse the Device selector to choose the specific device on which the DebugView\nreport will focus. This allows multiple developers to focus on their own\ninstrumentation and validation efforts without impacting one another."]]