DebugView를 사용하면 개발 기기에서 앱이 로깅하는 원시 이벤트 데이터를 거의 실시간으로 확인할 수 있습니다. 이 기능은 개발 중 계측 단계에서 검증하는 데 매우 유용하며, Analytics 구현 시의 오류와 실수를 발견하고 모든 이벤트와 사용자 속성이 정상적으로 로깅되는지 확인하는 데 도움이 됩니다.
디버그 모드 사용 설정
일반적으로 앱이 로깅하는 이벤트는 약 1시간 동안 취합된 후
일괄 업로드됩니다. 이렇게 하는 이유는 최종 사용자 기기의 배터리를
절약하고 네트워크 데이터 사용량을 줄이기 위함입니다. 그러나 개발 기기에서 디버그 모드를 사용 설정하여 이벤트를 업로드하는 지연 시간을 최소화하면 Analytics 구현을 검증하고 DebugView 보고서에서 Analytics를 조회할 수 있습니다.
iOS+
개발 기기에 Analytics 디버그 모드를 사용 설정하려면 Xcode에서 다음 명령줄 인수를 지정합니다.
-FIRDebugEnabled
이 동작은 다음 명령줄 인수를 지정하여 디버그 모드를 명시적으로 사용 중지할 때까지 유지됩니다.
-FIRDebugDisabled
프로젝트의 스키마를 수정하고 'Arguments Passed On Launch(실행 시 전달 인수)'에 새 항목을 추가하여 이러한 인수를 추가할 수 있습니다.
Android
Android 기기에서 Analytics 디버그 모드를 사용 설정하려면 다음 명령어를 실행합니다.
브라우저에서 Analytics 디버그 모드를 사용 설정하려면 Google 애널리틱스 디버거 Chrome 확장 프로그램을 설치하세요.
프로그램이 설치되면 확장 프로그램을 사용 설정하고 페이지를 새로고침합니다. 이 시점부터 확장 프로그램은 디버그 모드로 앱의 이벤트를 로깅합니다.
Firebase Console의 DebugView에서 로깅된 이벤트를 볼 수 있습니다.
이벤트 데이터 보고
개발 기기에서 디버그 모드를 사용 설정한 후 Google Analytics의 상단 탐색 메뉴에서 StreamView 옆의 화살표를 선택하고 DebugView를 선택하여 DebugView로 이동합니다.
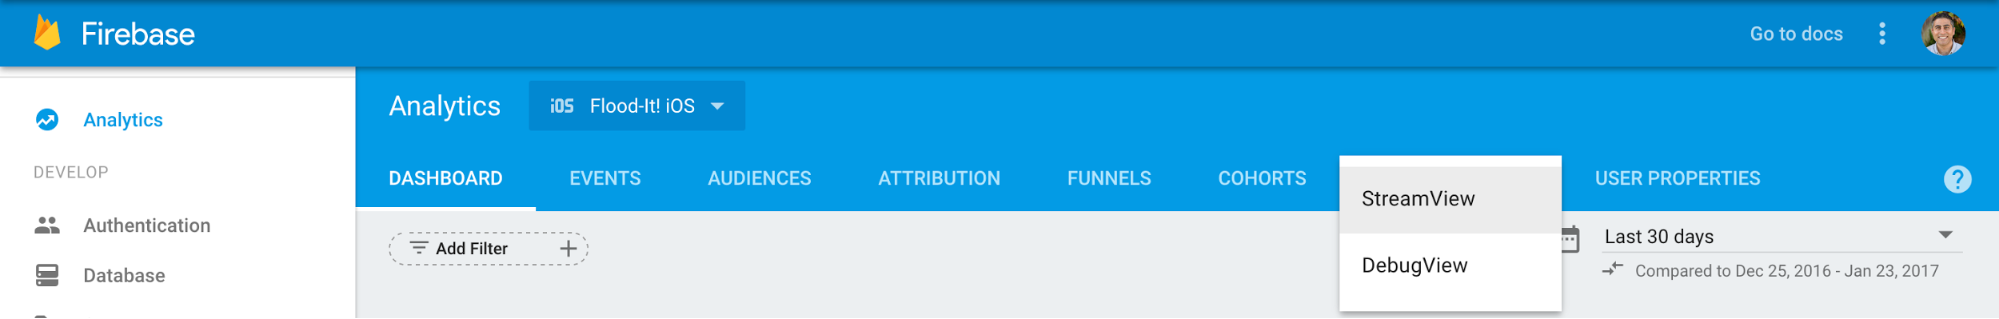
Google 애널리틱스 및 DebugView"> 선택
그런 다음 앱 사용을 시작하여 DebugView 보고서에 앱의 이벤트가 로깅되는지 확인합니다.
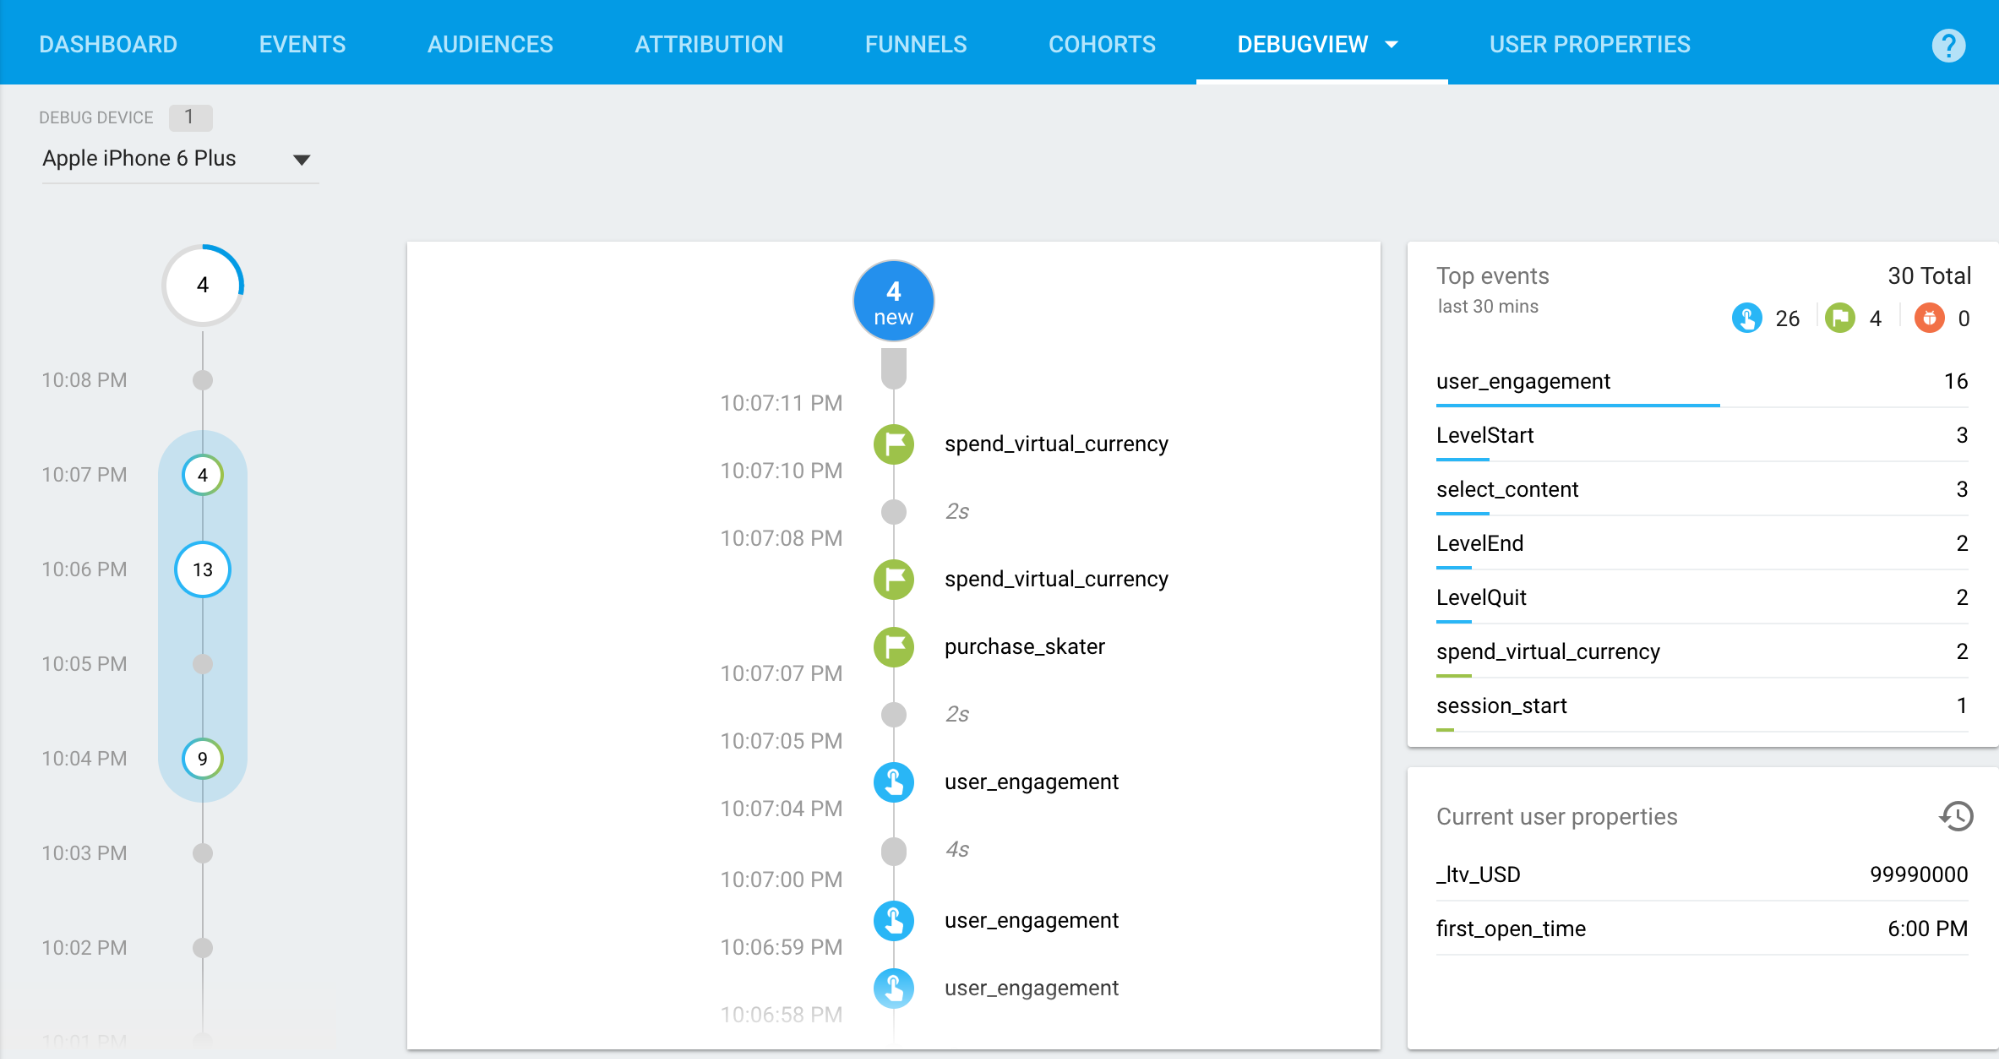
가운데 열의 초 스트림에는 최근 60초 동안 로깅된 이벤트가 표시됩니다. 왼쪽 열의 분 스트림에는 최근 30분 동안 보관 처리된
일련의 이벤트가 표시됩니다. 오른쪽 열에는 30분 동안 로깅된
상위 이벤트 및 현재 선택한 개발 기기의 현재 사용자 속성이
표시됩니다.
초 스트림
기본적으로 최근 60초 동안 로깅된 이벤트의 목록이 표시됩니다. 각
이벤트에는 개발 기기에 로깅된 시간의 타임스탬프가
표시됩니다. 이벤트를 클릭하여 이벤트에 연결된 매개변수 목록을 확인할 수 있습니다.
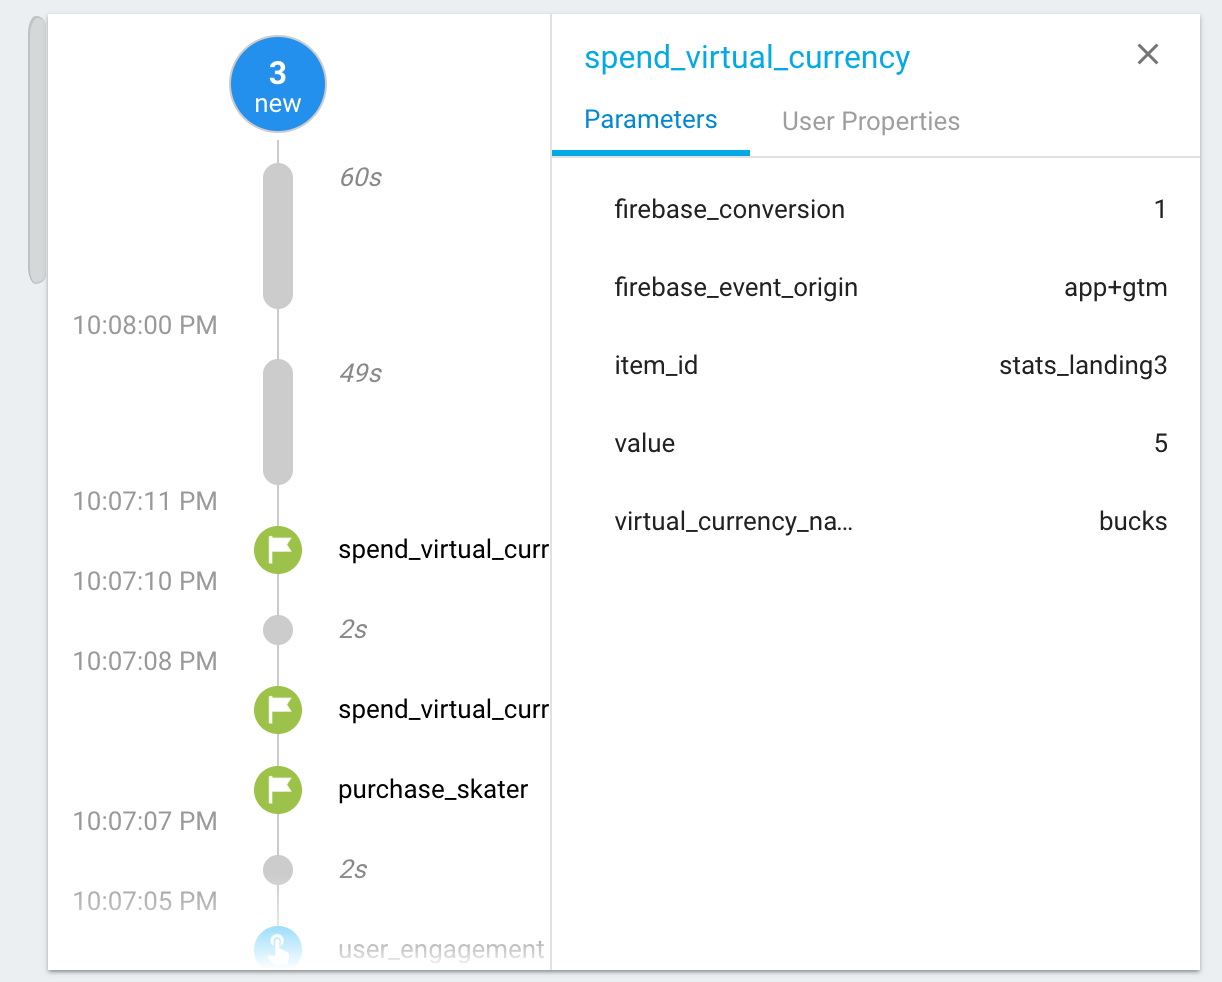
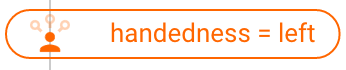
앱 사용 중에 사용자 속성 값이 변경되면 해당 변경 항목이 표시됩니다.
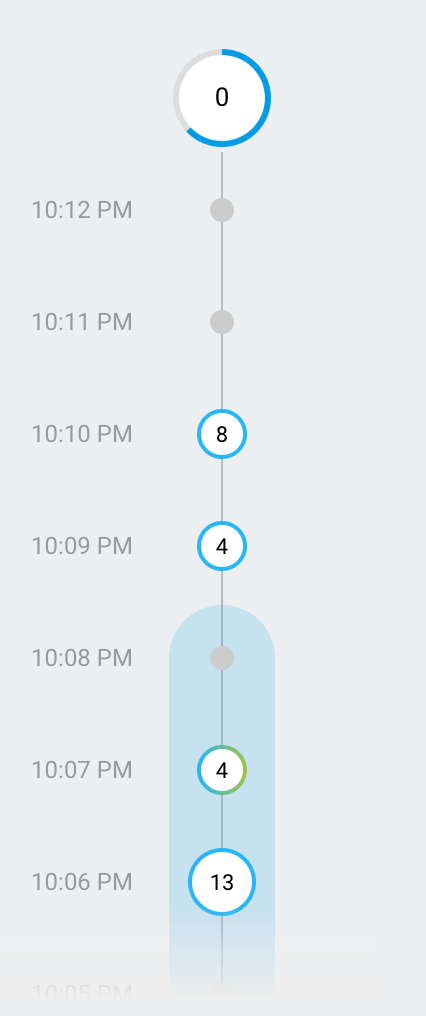
분 스트림
이 스트림에는 일련의 원이 표시되며 각 원은 최근 30분 중에서
1분씩을 가리킵니다. 원의 숫자는 각 1분에 수신된 이벤트 수를
나타냅니다. 이러한 원 중 하나를 클릭하면 초 스트림이 1분 동안
로깅된 이벤트로 채워집니다.
이러한 방식을 통해 최근 30분 동안 로깅된 이벤트를 자세히 조사할 수 있습니다.
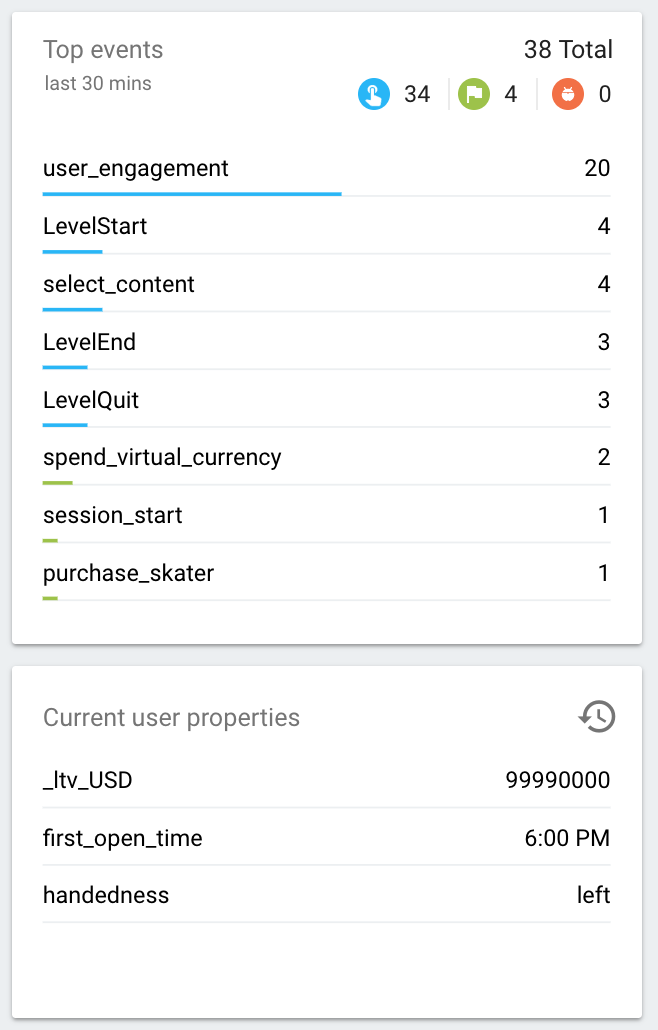
상위 이벤트 및 현재 사용자 속성
상위 이벤트 표에는 30분 동안 로깅된 상위 이벤트가
표시됩니다. 또한 현재 사용자 속성 표에는 선택한 개발 기기에 대한 사용자 속성 세트의 최신 상태가 표시됩니다.
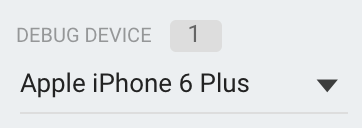
기기 선택기
다양한 개발 기기에서 디버그 모드를 사용 설정할 수 있으므로
기기 선택기를 사용하여 DebugView 보고서에서 초점을 맞출 특정 기기를
선택할 수 있습니다. 이를 통해 여러 개발자가 서로에게 영향을 주지 않고 자신이 담당한 계측과 검증 업무에 집중할 수 있습니다.
[[["이해하기 쉬움","easyToUnderstand","thumb-up"],["문제가 해결됨","solvedMyProblem","thumb-up"],["기타","otherUp","thumb-up"]],[["필요한 정보가 없음","missingTheInformationINeed","thumb-down"],["너무 복잡함/단계 수가 너무 많음","tooComplicatedTooManySteps","thumb-down"],["오래됨","outOfDate","thumb-down"],["번역 문제","translationIssue","thumb-down"],["샘플/코드 문제","samplesCodeIssue","thumb-down"],["기타","otherDown","thumb-down"]],["최종 업데이트: 2025-09-04(UTC)"],[],[],null,["DebugView enables you to see the raw event data logged by your app on\ndevelopment devices in near real-time. This is very useful for validation\npurposes during the instrumentation phase of development and can help you\ndiscover errors and mistakes in your Analytics implementation and confirm\nthat all events and user properties are logged correctly.\n\nEnable debug mode\n\nGenerally, events logged by your app are batched together over the period of\napproximately one hour and uploaded together. This approach conserves the\nbattery on end users' devices and reduces network data usage. However, for the\npurposes of validating your Analytics implementation (and, in order to\nview your Analytics in the DebugView report), you can enable debug mode\non your development device to upload events with a minimal delay. \n\niOS+\n\nTo enable Analytics debug mode on your development device, specify the\nfollowing command line argument in Xcode: \n\n -FIRDebugEnabled\n\nThis behavior persists until you explicitly disable debug mode by specifying\nthe following command line argument: \n\n -FIRDebugDisabled\n\nYou can add these arguments by editing your project's scheme and adding a\nnew entry to \"Arguments Passed On Launch\".\n\nAndroid\n\nTo enable Analytics debug mode on an Android device,\nexecute the following commands:\n\n\u003cbr /\u003e\n\n```\nadb shell setprop debug.firebase.analytics.app PACKAGE_NAME\n```\n\n\u003cbr /\u003e\n\nThis behavior persists until you explicitly disable debug mode by executing\nthe following command:\n\n\u003cbr /\u003e\n\n```\nadb shell setprop debug.firebase.analytics.app .none.\n```\n\n\u003cbr /\u003e\n\nWeb\n\nTo enable Analytics debug mode in your browser, install the\n[Google Analytics Debugger](https://chrome.google.com/webstore/detail/google-analytics-debugger/jnkmfdileelhofjcijamephohjechhna)\nChrome extension.\n\nOnce installed, enable the extension and refresh the page. From that point\non, the extension will log events in your app in debug mode.\n\nYou can view events logged in the DebugView in the Firebase console.\n| **Note:** To prevent your testing and development from affecting your measurements, events logged while in debug mode will be excluded from your overall Analytics data, and will not be included in your daily BigQuery export.\n\nReport on event data\n\nOnce you enable debug mode on your development devices, navigate to\n[DebugView](//console.firebase.google.com/project/_/analytics/debugview) by selecting the\narrow next to StreamView on the top nav of Google Analytics and\nselecting DebugView.\n\nGoogle Analytics and selecting DebugView\"\\\u003e\n\nThen, just start using your app to see your app's events being logged in the\nDebugView report.\n\nThe Seconds stream (the middle column) shows the events which have been logged\nin the last 60 seconds. The Minutes stream (the left column) shows a series of\narchives of events over the last 30 minutes. And the right column shows the\nTop Events logged in the 30-minute period as well as the Current User Properties\nfor the currently selected development device.\n\nSeconds stream\n\nBy default, you will see a list of events logged in the last 60 seconds. Each\nevent displays a timestamp that corresponds to the time of its logging on the\ndevelopment device. You can click on an event to see a list of the parameters\nthat were associated with that event.\n\nAs user property values change during the course of app usage, you will see an\nentry for that change.\n\nMinutes stream\n\nThis stream shows a series of circles which each correspond to a minute of time\nover the last 30 minutes. The number in the circle indicates the count of\nevents received in that minute. Clicking on one of these circles will populate\nthe Seconds stream with events which were logged during that minute of time.\nThis effectively allows you to examine the events logged over the last 30\nminutes in fine-grained detail.\n\nTop events and Current User Properties\n\nThe Top Events table shows the top events which were logged during the 30-minute\nperiod. And the Current User Properties table shows the latest state of the set\nof User Properties for the currently selected development device.\n\nDevice selector\n\nSince many different development devices can have debug mode enabled, you can\nuse the Device selector to choose the specific device on which the DebugView\nreport will focus. This allows multiple developers to focus on their own\ninstrumentation and validation efforts without impacting one another."]]