Mit Sammlungen den Überblick behalten
Sie können Inhalte basierend auf Ihren Einstellungen speichern und kategorisieren.
Mit Performance Monitoring können Sie Leistungsdaten anhand von Attributen segmentieren und sich auf die Leistung Ihrer App in verschiedenen realen Szenarien konzentrieren.
Nachdem Sie in der Tabelle mit den Traces (unten im Leistungs-Dashboard) auf einen Trace-Namen geklickt haben, können Sie die gewünschten Messwerte aufrufen. Mit der Schaltfläche Filternadd (oben links auf dem Bildschirm) können Sie die Daten nach Attribut filtern, z. B.:
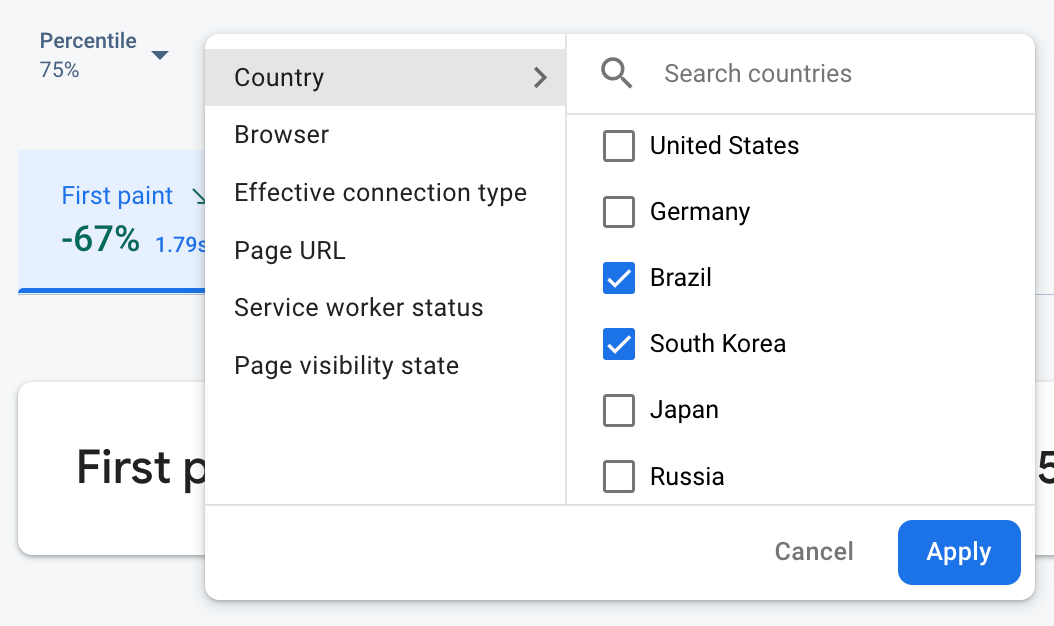
Firebase Performance Monitoring-Daten werden nach Attribut gefiltert." />
Filtern Sie nach Seiten-URL, um Daten für eine bestimmte Seite Ihrer Website aufzurufen.
Filtern Sie nach Effektiver Verbindungstyp, um zu sehen, wie sich eine 3G-Verbindung auf Ihre App auswirkt.
Filtern Sie nach Land, um sicherzustellen, dass sich der Datenbankstandort nicht auf eine bestimmte Region auswirkt.
Standardattribute
In Performance Monitoring werden je nach Art des Traces automatisch verschiedene Standardattribute erfasst.
Zusätzlich zu diesen Standardattributen können Sie auch benutzerdefinierte Attribute für Ihre benutzerdefinierten Code-Traces erstellen, um Daten nach Kategorien zu segmentieren, die für Ihre App spezifisch sind. In einem Spiel können Sie Daten beispielsweise nach Spiellevel segmentieren.
Standardattribute, die für Web-Apps erhoben werden
Für alle Web-App-Traces werden standardmäßig die folgenden Attribute erfasst:
Verwenden Sie die Performance Monitoring Trace API, um benutzerdefinierten Code-Traces benutzerdefinierte Attribute hinzuzufügen.
Wenn Sie benutzerdefinierte Attribute verwenden möchten, müssen Sie Ihrer App Code hinzufügen, der das Attribut definiert und es einem bestimmten benutzerdefinierten Code-Trace zuordnet. Sie können das benutzerdefinierte Attribut jederzeit zwischen dem Start und dem Ende des Traces festlegen.
Wichtige Hinweise:
Namen für benutzerdefinierte Attribute müssen die folgenden Anforderungen erfüllen:
Keine voran- oder nachgestellten Leerzeichen, kein vorangestellter Unterstrich (_)
Keine Gruppenbereiche
Maximale Länge: 32 Zeichen
Zulässige Zeichen für den Namen sind A-Z, a-z und _.
Für jeden benutzerdefinierten Code-Trace können bis zu 5 benutzerdefinierte Attribute erfasst werden.
Achten Sie darauf, dass benutzerdefinierte Attribute keine Informationen enthalten, die eine Person gegenüber Google identifizieren.
[[["Leicht verständlich","easyToUnderstand","thumb-up"],["Mein Problem wurde gelöst","solvedMyProblem","thumb-up"],["Sonstiges","otherUp","thumb-up"]],[["Benötigte Informationen nicht gefunden","missingTheInformationINeed","thumb-down"],["Zu umständlich/zu viele Schritte","tooComplicatedTooManySteps","thumb-down"],["Nicht mehr aktuell","outOfDate","thumb-down"],["Problem mit der Übersetzung","translationIssue","thumb-down"],["Problem mit Beispielen/Code","samplesCodeIssue","thumb-down"],["Sonstiges","otherDown","thumb-down"]],["Zuletzt aktualisiert: 2025-09-05 (UTC)."],[],[],null,["\u003cbr /\u003e\n\niOS+ Android Web \n\n\u003cbr /\u003e\n\nWith Performance Monitoring, you can use attributes to segment performance data and focus\non your app's performance in different real-world scenarios.\n\nAfter you click a trace name in the traces table (located at the bottom of\nthe\n[*Performance* dashboard](//console.firebase.google.com/project/_/performance)), you can drill down into\nmetrics of interest. Use the\n**Filteradd** button\n(top-left of the screen) to filter the data by attribute, for example:\n\nFirebase Performance Monitoring data being filtered by attribute\" /\\\u003e\n\n- Filter by *App version* to view data about a past release or your latest release\n- Filter by *Device* to learn how older devices handle your app\n- Filter by *Country* to make sure your database location isn't affecting a specific region\n\nFor even more powerful analysis based on attributes,\n[export your performance data to BigQuery](/docs/perf-mon/bigquery-export).\n\nDefault attributes\n\nPerformance Monitoring automatically collects a variety of default attributes depending\non the type of trace.\n\nIn addition to these default attributes, you can also\n[create custom attributes](#create-custom-attributes) on your\n[custom code traces](/docs/perf-mon/custom-code-traces) to segment data by\ncategories specific to your app. For example, in a game, you can segment data by\ngame level.\n\nDefault attributes for Apple and Android apps\n\nAll traces for Apple and Android apps collect the following attributes by default:\n\n- App version\n- Country\n- OS level\n- Device\n- Radio\n- Carrier\n\nIn addition, network request traces also collect the following attribute:\n\n- MIME type\n\nCollecting user data **Collecting user data:** Performance Monitoring does not itself collect\n| any personally identifiable information (PII), such as names, email\n| addresses, or phone numbers. Developers can collect additional data using\n| Performance Monitoring by creating custom attributes on custom code traces. Such data collected through\n| Performance Monitoring should not contain information that personally identifies an\n| individual to Google.\n|\n| Here's an example of a log message that *does not* contain\n| personally identifiable information: \n|\n| ```java\n| trace.putAttribute(\"experiment\", \"A\");\n| ```\n|\n| Here's an example that *does* contain personally\n| identifiable information (***do not use*** this type of\n| custom attribute in your app): \n|\n| ```java\n| trace.putAttribute(\"email\", user.getEmailAddress());\n| ```\n|\n| Data that exposes any personally identifiable information is subject to\n| deletion without notice.\n\nCreate custom attributes\n\nYou can create custom attributes on any of your instrumented\n[custom code traces](/docs/perf-mon/custom-code-traces).\n\nUse the Performance Monitoring Trace API\n([Swift](/docs/reference/swift/firebaseperformance/api/reference/Classes/Trace)\n\\|\n[Obj-C](/docs/reference/ios/firebaseperformance/api/reference/Classes/FIRTrace))\nto add custom attributes to custom code traces.\n\nTo use custom attributes, add code to your app that defines the attribute and\nassociates it with a specific custom code trace. You can set the custom\nattribute anytime between when the trace starts and when the trace stops.\n\nNote the following:\n\n- Names for custom attributes must meet the following requirements:\n\n - No leading or trailing whitespace, no leading underscore (`_`) character\n - No spaces\n - Max length is 32 characters\n - Allowed characters for the name are `A-Z`, `a-z`, and `_`.\n- Each custom code trace can record up to 5 custom attributes.\n\n- Please ensure that custom attributes do not contain any information that\n personally identifies an individual to Google.\n\n Learn more about this guideline\n | **Collecting user data:** Performance Monitoring does not itself collect\n | any personally identifiable information (PII), such as names, email\n | addresses, or phone numbers. Developers can collect additional data using\n | Performance Monitoring by creating custom attributes on custom code traces. Such data collected through\n | Performance Monitoring should not contain information that personally identifies an\n | individual to Google.\n |\n | Here's an example of a log message that *does not* contain\n | personally identifiable information: \n |\n | ```java\n | trace.putAttribute(\"experiment\", \"A\");\n | ```\n |\n | Here's an example that *does* contain personally\n | identifiable information (***do not use*** this type of\n | custom attribute in your app): \n |\n | ```java\n | trace.putAttribute(\"email\", user.getEmailAddress());\n | ```\n |\n | Data that exposes any personally identifiable information is subject to\n | deletion without notice.\n\nSwift\n\n\n**Note:** This Firebase product is not available on macOS, Mac Catalyst, watchOS targets. \n\n```swift\nlet trace = Performance.startTrace(name: \"\u003cvar class=\"readonly\" translate=\"no\"\u003eCUSTOM_TRACE_NAME\u003c/var\u003e\")\n\ntrace.setValue(\"A\", forAttribute: \"experiment\")\n\n// Update scenario.\ntrace.setValue(\"B\", forAttribute: \"experiment\")\n\n// Reading scenario.\nlet experimentValue:String? = trace.valueForAttribute(\"experiment\")\n\n// Delete scenario.\ntrace.removeAttribute(\"experiment\")\n\n// Read attributes.\nlet attributes:[String, String] = trace.attributes;\n```\n\nObjective-C\n\n\n**Note:** This Firebase product is not available on macOS, Mac Catalyst, watchOS targets. \n\n```objective-c\nFIRTrace *trace = [FIRPerformance startTraceWithName:@\"\u003cvar class=\"readonly\" translate=\"no\"\u003eCUSTOM_TRACE_NAME\u003c/var\u003e\"];\n\n[trace setValue:@\"A\" forAttribute:@\"experiment\"];\n\n// Update scenario.\n[trace setValue:@\"B\" forAttribute:@\"experiment\"];\n\n// Reading scenario.\nNSString *experimentValue = [trace valueForAttribute:@\"experiment\"];\n\n// Delete scenario.\n[trace removeAttribute:@\"experiment\"];\n\n// Read attributes.\nNSDictionary \u003cNSString *, NSString *\u003e *attributes = [trace attributes];\n```"]]