
There are multiple ways to use Firebase Test Lab to run tests on your Android app, including the command line interface, Android Studio, the Test Lab UI in the Firebase console, and the Testing API. However you choose to start your tests, the results are stored in the Firebase project that you specify. You can explore the results using ToolResults API in addition to any of the tools above. This page describes how to review and analyze these test results.
Key concepts
To see the results from all your previous test runs, select Test Lab in the left navigation panel of your project in the Firebase console. This page displays all the test runs from the apps that you have tested with your project using Test Lab.
To review test results, you first need to understand three concepts:
When you run a test or a set of test cases against devices and configurations you've selected, Test Lab runs the test against your app in a batch, then displays the results as a test matrix.
Devices × Test Executions = Test Matrix
- Device
- A physical or virtual device (Android only) you run a test on, such as a phone, tablet, or wearable device. Devices in a test matrix are identified by device model, OS version, screen orientation, and locale (also known as geography and language settings).
- Test, test execution
- A test (or a set of test cases) to be run on a device. You can run one test per device, or optionally shard the test and run its test cases on different devices.
- Test matrix
- Contains the statuses and test results for your test executions. If any test execution in a matrix fails, the whole matrix fails.
The following sections explain how to navigate test results.
Interpret test history results
When you navigate to your test results by selecting Test Lab, you see the results of tests you have run so far.
Testing history is grouped by app. Only the most recent five test matrices are shown for each app; if more are available, you can click the All Matrices link at the bottom of the app test list to see the complete list for that app.
Interpret test matrix results
When starting a test through the Test Lab UI, you are redirected to a page where you can see your test matrix and click a specific test execution to view test results. Android Studio and the gcloud command provide a URL for the test matrix results page as well.
In a typical test matrix, you might run a test across a dozen or so different devices. Each test execution can have a different outcome. The possible outcomes for any test execution in a test matrix include the following:
- Passed
 : No failures were encountered.
 - Failed
 : At least one failure was
encountered.
: At least one failure was
encountered. - Inconclusive
 : Test results were
inconclusive, possibly due to a Test Lab error.
: Test results were
inconclusive, possibly due to a Test Lab error. - Skipped
 : The selected dimension values
for some test executions in the matrix were incompatible. This occurs when
devices that you selected are incompatible with one or more of the Android API
levels that you selected.
: The selected dimension values
for some test executions in the matrix were incompatible. This occurs when
devices that you selected are incompatible with one or more of the Android API
levels that you selected.
To review aggregated test results for all test matrices for a given app in your Firebase project, click the name of the app, as shown in the following example:
Example test matrix results page with only four test executions
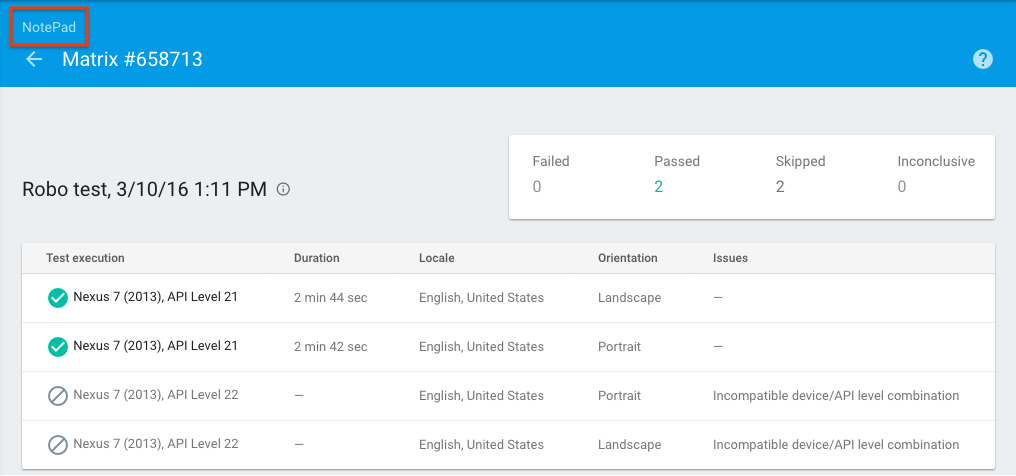
This takes you to the test matrix list for your app, where you can click the name of any test matrix to see the test matrix results, and where you can click the name of the app (shown in the red box below) to view the test matrix list for other apps associated with your Firebase project.
Example test matrix list page
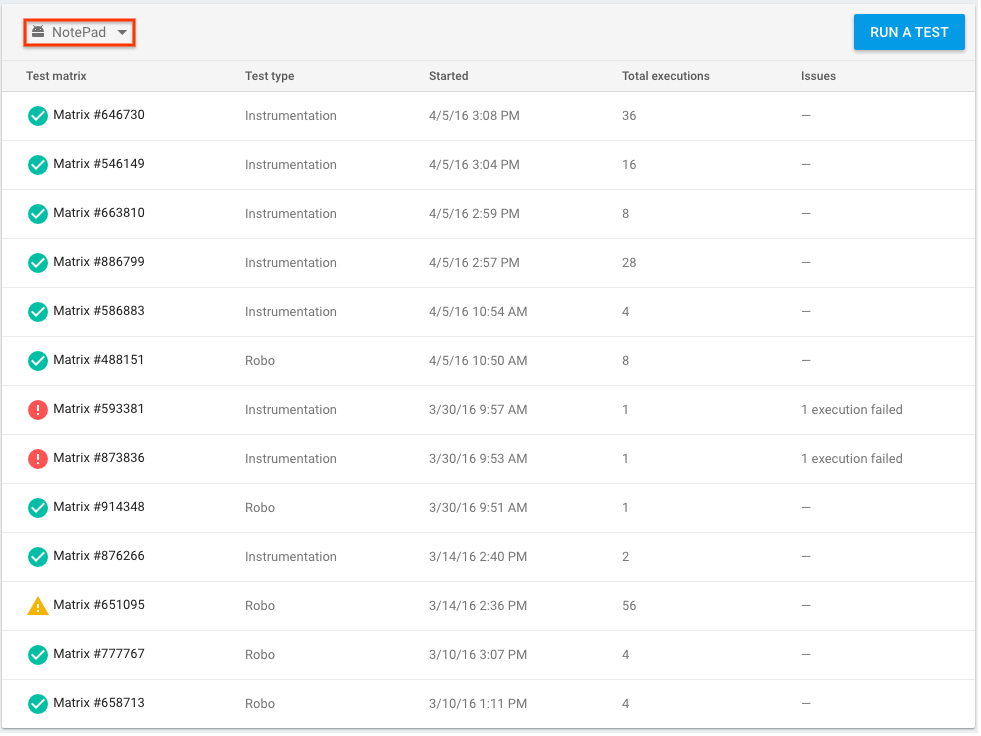
A test matrix can pass, fail, or be inconclusive. A test matrix is shown as failed or inconclusive if any test executions in that matrix fail or are inconclusive.
Interpret Robo test results
If you ran your tests with Robo, your results include videos and screenshots of Robo crawling your UI, in addition to the usual test metrics. Those video and screenshots include visual indications of the actions Robo took during the crawl, similar to the 'Show touches' feature in Android. You can use the indications to help you follow along with Robo's progress, and reproduce any bugs it might uncover.
Example Robo test results video
Interpret results from a single test execution
From the test matrix results page, click on one of the test executions to see the result of that specific test execution.
Example test execution results page
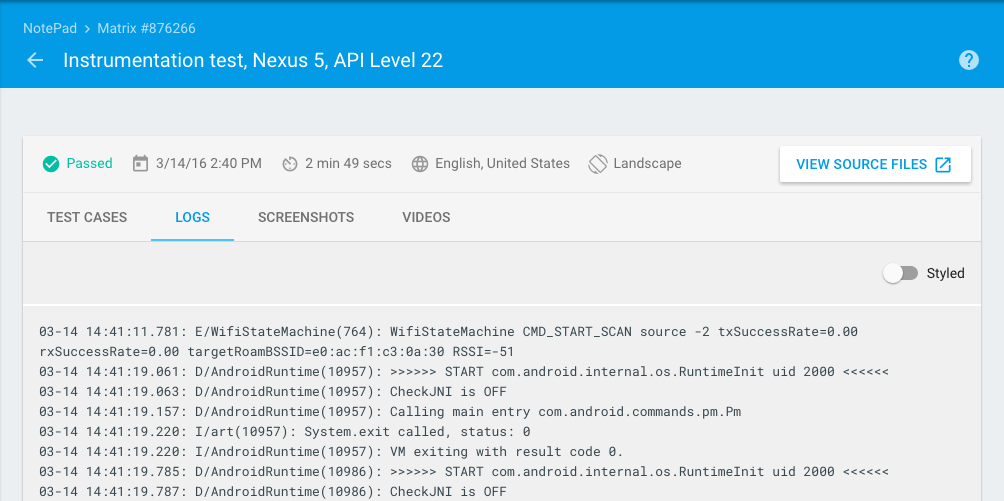
On this page, you can see the time required for each test execution. You can also see the results for specific test cases that correspond to methods in your test APK (for instrumentation tests) and detailed test results, including test logs, screenshots, and videos. For Robo test, detailed test results also include an activity map that graphically shows the UI paths that were visited by Robo test.
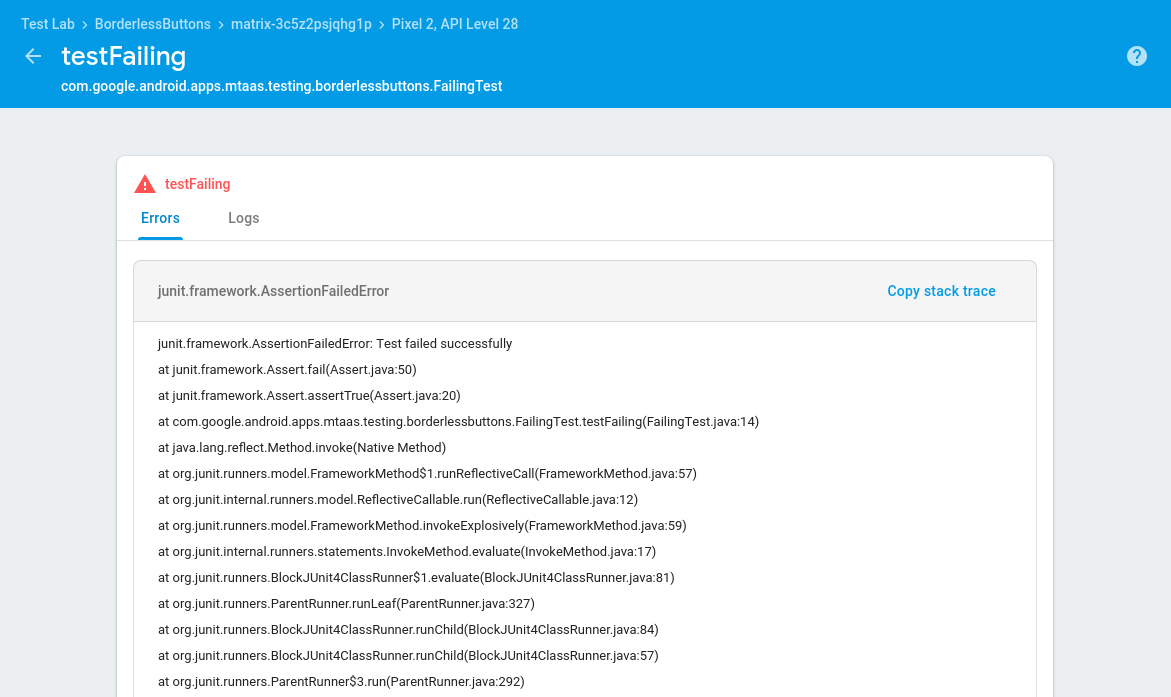
Partitioned instrumentation test results
To help you interpret instrumented test results, Test Lab separates each test into its own detailed report page, complete with stack traces, logs, and videos. This feature works whether or not you are using Android Orchestrator.
Example testcase results page
Interpret accessibility results
Robo tests use Android Accessibility Scanner to detect accessibility issues in your app (note that you can also run a scan locally on your device). For instructions on how to review and interpret the accessibility results of your Robo test, visit Get started with Accessibility Scanner.
For general information on how to improve the accessibility of your app, visit the Android Developer Accessibility documentation.
Performance metrics
Tests run on physical devices also return performance metrics:
| Metric | Required device configuration |
|---|---|
| App startup time | API 19+ |
| CPU usage | API 21+ |
| Memory usage | |
| Network activity | |
| Frames per second | API 21+ and includes a SurfaceView |
Detailed test results
Detailed test results are available for 90 days after you run a test and are stored in a Google Cloud Storage bucket (but are also visible in the Firebase console). You can view detailed test results in the Cloud Storage bucket when you click Test results on the test execution results page. When detailed test results are no longer available, you can still see which tests passed or failed.
To retain detailed test results for longer than 90 days, you need to send these test results to a Cloud Storage bucket that you own using the --results-bucket gcloud command-line option. You can then set the Age setting to determine how long results are stored in your Cloud Storage bucket. See Lifecycle conditions for information about how to change the Age setting.