
Firebase 프로젝트 관리의 일환으로 Cloud Storage의 사용량(예: 저장된 바이트 수, 앱에서 발생하는 다운로드 요청 수)을 검토하는 것이 좋습니다.
Cloud Storage 청구 사용량을 검토하려면 사용량 및 청구 대시보드를 확인하세요.
리소스 사용량의 경우 Firebase Console의 Cloud Storage 사용량 탭과 Cloud Monitoring을 통해 제공되는 측정항목이 Cloud Storage 사용량을 모니터링하는 데 도움이 될 수 있습니다. 이러한 유형의 모니터링으로 앱에서 잠재적인 문제를 발견할 수 있으며 앱 사용량을 살펴보면 청구 비용을 예상할 수 있습니다. 또한 Cloud Storage 버킷의 작업(예: Cloud Storage Security Rules의 평가 모니터링)을 명확하게 파악할 수 있어 이상이 발견될 경우 문제 해결 도구로도 유용합니다.
Firebase 콘솔
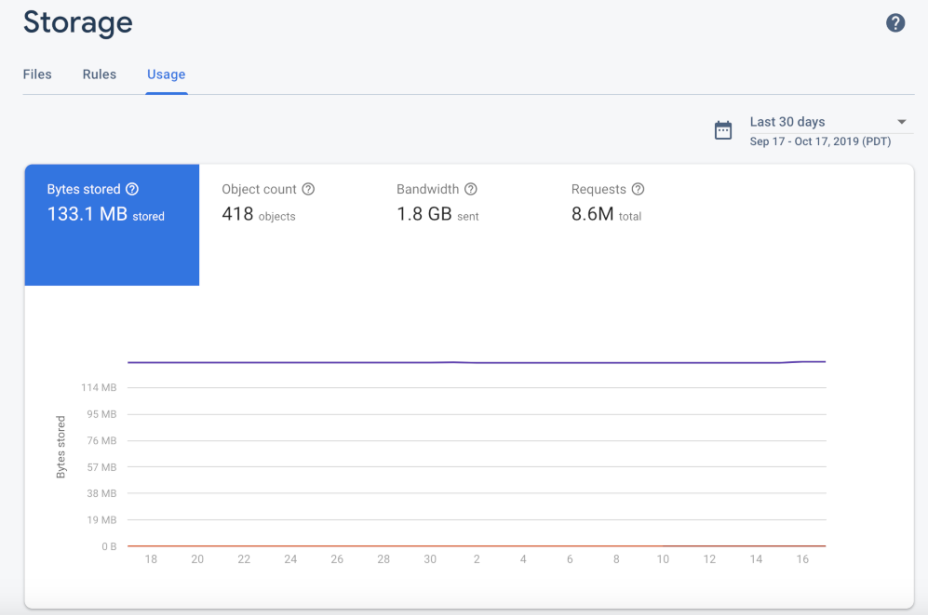
Firebase Console에는 시간 경과에 따른 저장된 스토리지 바이트 수, 객체 수, 대역폭, 다운로드 요청 수를 보여주는 사용량 대시보드가 있습니다. 스토리지 측정항목(저장된 바이트 및 객체 수)은 24시간 내에 업데이트됩니다. 사용량 측정항목(대역폭 및 다운로드 요청)은 몇 시간마다 업데이트됩니다.
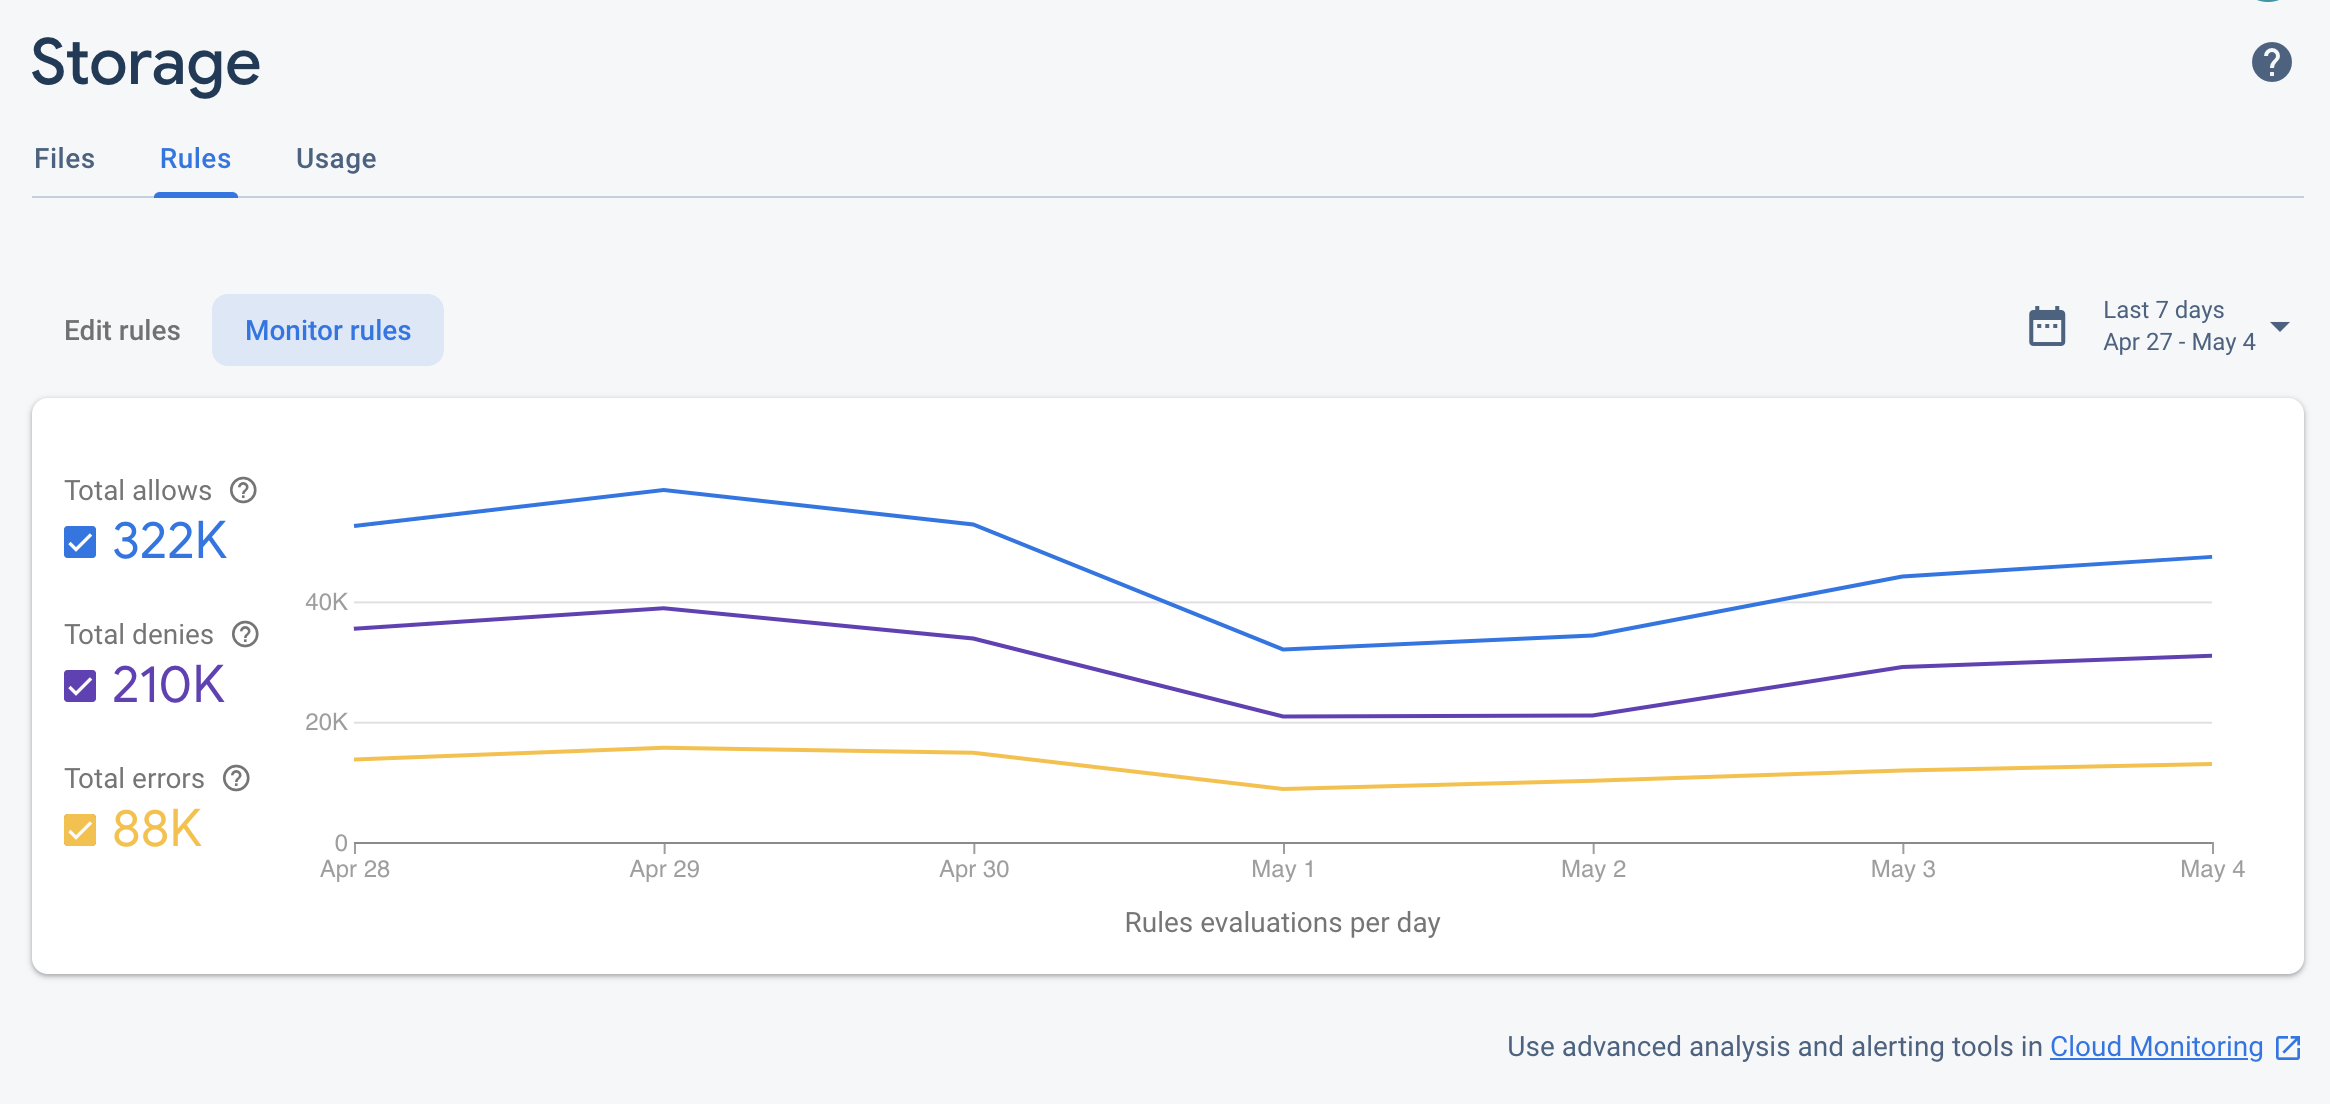
또한 Firebase Console은 규칙 호출에 관한 유용한 정보를 한눈에 볼 수 있는 Firebase Security Rules 평가 대시보드를 제공합니다. Cloud Monitoring을 통해 Firebase Security Rules 사용량을 모니터링할 수도 있습니다. 이를 통해 동일한 규칙 평가 측정항목을 제공하며, 맞춤 대시보드를 빌드하고, 추세를 분석하고, 알림을 구성할 수 있습니다(예: 거부된 요청이 급증하는 경우). 사용 가능한 전체 측정항목 목록은 Cloud Monitoring 측정항목 참조를 참조하세요.
Google Cloud 콘솔
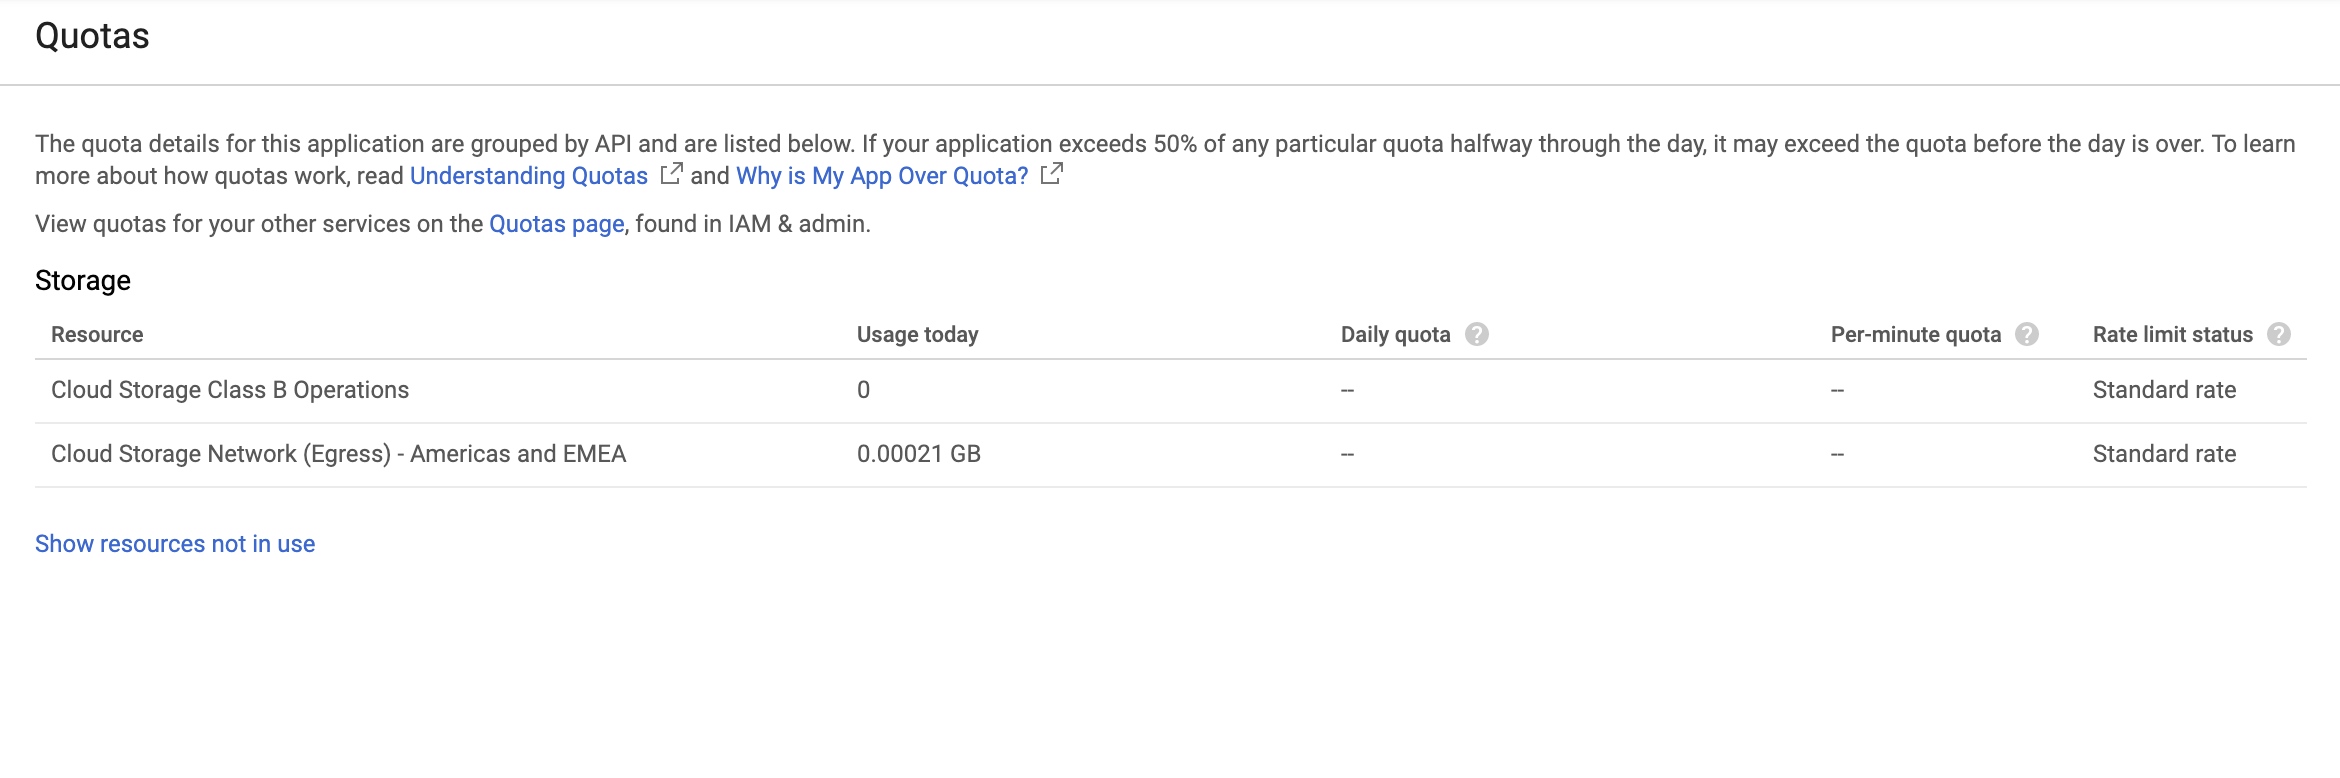
Firebase 프로젝트는 Firebase 서비스 및 구성이 추가된 Google Cloud 프로젝트이므로 Google Cloud 콘솔에서 프로젝트를 볼 수 있습니다.
이름 형식이 *.appspot.com
Cloud Monitoring
Cloud Monitoring은 대시보드, 차트, 알림을 만드는 데 사용할 수 있는 Google Cloud 제품의 측정항목, 이벤트, 메타데이터를 수집합니다. Cloud Monitoring에는 다음과 같은 보안 규칙 관련 Cloud Storage 측정항목이 포함됩니다.
| 측정항목 이름 | 설명 |
|---|---|
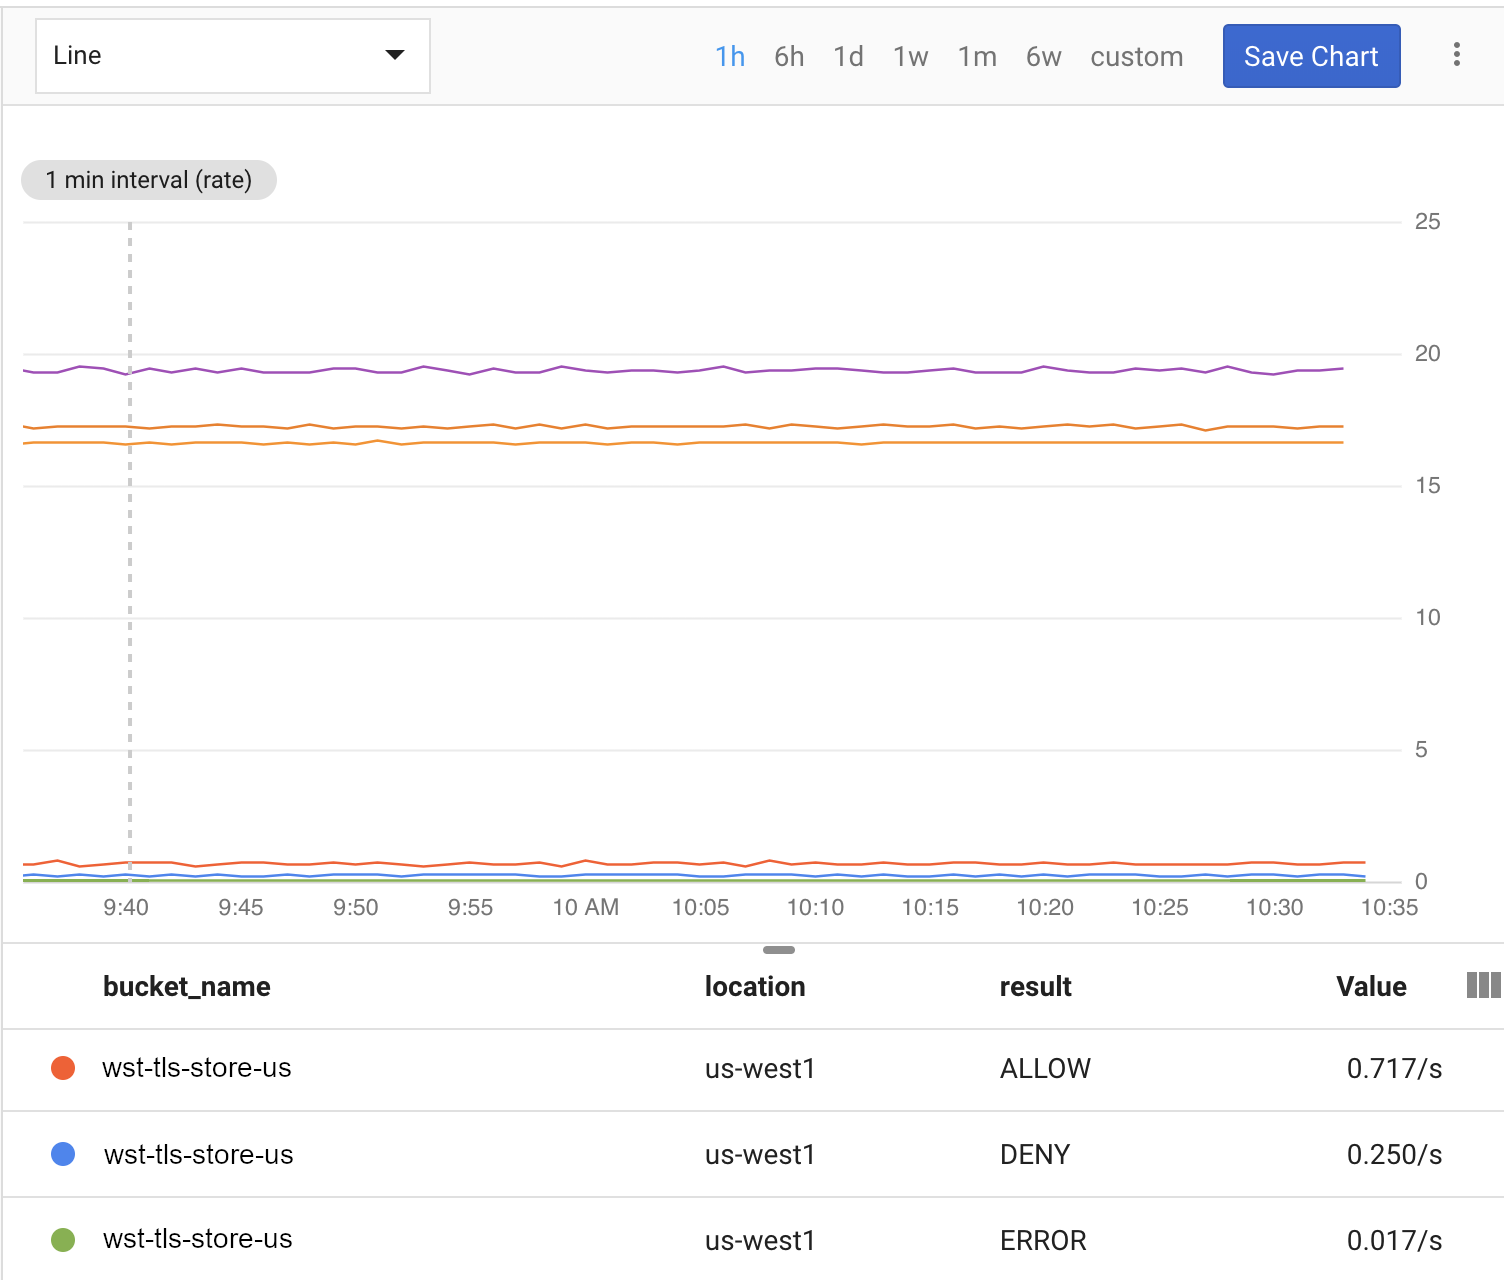
| 규칙 평가 | 쓰기 또는 읽기 요청에 대한 응답으로 수행된 Cloud Storage Security Rules의 평가 수입니다. 요청의 결과(ALLOW, DENY 또는 ERROR)나 버킷 이름을 기준으로 이 측정항목을 분류할 수 있습니다. |
- 샘플링 레이트
- Cloud Storage 측정항목은 60초마다 샘플링되지만 업데이트 내용이 대시보드에 표시되려면 최대 4분이 걸릴 수 있습니다.
이러한 측정항목을 사용하여 다음과 같은 Cloud Storage 대시보드를 설정할 수 있습니다.
Cloud Monitoring으로 Cloud Storage 모니터링을 시작하려면 아래 단계를 완료하세요.
Cloud Monitoring 작업공간 만들기
Cloud Monitoring으로 Firebase를 모니터링하려면 프로젝트에 작업공간을 설정해야 합니다. 작업공간은 하나 이상의 프로젝트로 모니터링 정보를 구성합니다. 작업공간을 설정한 후 커스텀 대시보드 및 알림 정책을 만들 수 있습니다.
-
프로젝트가 이미 작업공간의 일부인 경우 Cloud Monitoring 페이지가 열립니다. 그렇지 않으면 프로젝트의 작업 공간을 선택합니다.
새 작업공간 옵션을 선택하거나 기존 작업공간을 선택합니다.
추가를 클릭합니다. 작업공간이 빌드되면 Cloud Monitoring 페이지가 열립니다.
대시보드 만들기 및 차트 추가
Cloud Monitoring에서 수집된 Firebase 측정항목을 자체 차트와 대시보드에 표시합니다.
계속하기 전에 프로젝트가 Cloud Monitoring 작업공간의 일부인지 확인하세요.
Cloud Monitoring 페이지에서 작업공간을 열고 대시 보드 페이지로 이동합니다.
대시보드 만들기를 클릭하고 대시보드 이름을 입력합니다.
오른쪽 상단에서 차트 추가를 클릭합니다.
차트 추가 창에 차트 제목을 입력합니다. 측정항목 탭을 클릭합니다.
리소스 유형 및 측정항목 찾기 필드에 Firebase용 Cloud Storage를 입력합니다. 자동으로 입력된 드롭다운에서 Cloud Storage 측정항목 중 하나를 선택합니다.
동일한 차트에 측정항목을 더 추가하려면 측정항목 추가를 클릭하고 이전 단계를 반복합니다.
필요에 따라 차트를 맞춤 설정합니다. 예를 들어 필터 필드에서 + 필터 추가를 클릭합니다. 아래로 스크롤한 후 차트에서 필터링할 측정항목 값 또는 범위를 선택합니다.
저장을 클릭합니다.
Cloud Monitoring 차트에 대한 자세한 내용은 차트 다루기를 참조하세요.
알림 정책 만들기
Firebase 측정항목을 기반으로 알림 정책을 만들 수 있습니다. 아래 단계를 수행하면 특정 Firebase 측정항목이 특정 기준에 도달할 때마다 이메일을 보내는 알림 정책을 만들 수 있습니다.
계속하기 전에 프로젝트가 Cloud Monitoring 작업공간의 일부인지 확인하세요.
Cloud Monitoring 페이지에서 작업공간을 열고 알림 페이지로 이동합니다.
정책 만들기를 클릭합니다.
알림 정책 이름을 입력합니다.
Firebase 측정항목 중 하나를 기반으로 알림 조건을 추가합니다. 조건 추가를 클릭합니다.
타겟을 선택합니다. 리소스 유형 및 측정항목 찾기 필드에 Firebase용 Cloud Storage를 입력합니다. 자동으로 입력된 드롭다운에서 Cloud Storage 측정항목 중 하나를 선택합니다.
정책 트리거 아래의 드롭다운 필드를 사용하여 알림 조건을 정의합니다.
알림 정책에 알림 채널을 추가합니다. 알림에서 알림 채널 추가를 클릭합니다. 드롭다운 메뉴에서 이메일을 선택합니다.
이메일 주소 필드에 이메일을 입력합니다. 추가를 클릭합니다.
필요한 경우 문서 필드를 작성하여 이메일 알림에 추가 정보를 포함합니다.
저장을 클릭합니다.
Cloud Storage 사용량이 구성된 기준을 초과하면 이메일 알림이 수신됩니다.
알림 정책에 관한 자세한 내용은 알림 소개를 참조하세요.