
كجزء من إدارة مشاريعك على Firebase، عليك مراجعة استخدام Cloud Storage (على سبيل المثال، عدد وحدات البايت التي يتم تخزينها، وعدد طلبات التنزيل الواردة من تطبيقاتك).
لمراجعة Cloud Storage الاستخدام الذي تم تحصيل رسوم مقابله، اطّلِع على لوحة بيانات الاستخدام والفوترة.
بالنسبة إلى استخدام الموارد، يمكن أن يساعدك كل من علامة التبويب Cloud Storage الاستخدام في وحدة تحكّم Firebase والمقاييس المتاحة من خلال Cloud Monitoring في تتبُّع استخدام Cloud Storage. يمكن أن يساعدك هذا النوع من المراقبة في رصد المشاكل المحتملة في تطبيقك، كما أنّ الاطّلاع على استخدام تطبيقك يمكن أن يقدّم لك معلومات عن فاتورتك. بالإضافة إلى ذلك، إذا بدا أنّ هناك مشكلة، يمكن أن يكون الحصول على صورة واضحة لعمليات مجموعة Cloud Storage (على سبيل المثال، من خلال مراقبة تقييم Cloud Storage Security Rules) مفيدًا في تحديد المشاكل وحلّها.
Firebase وحدة التحكّم
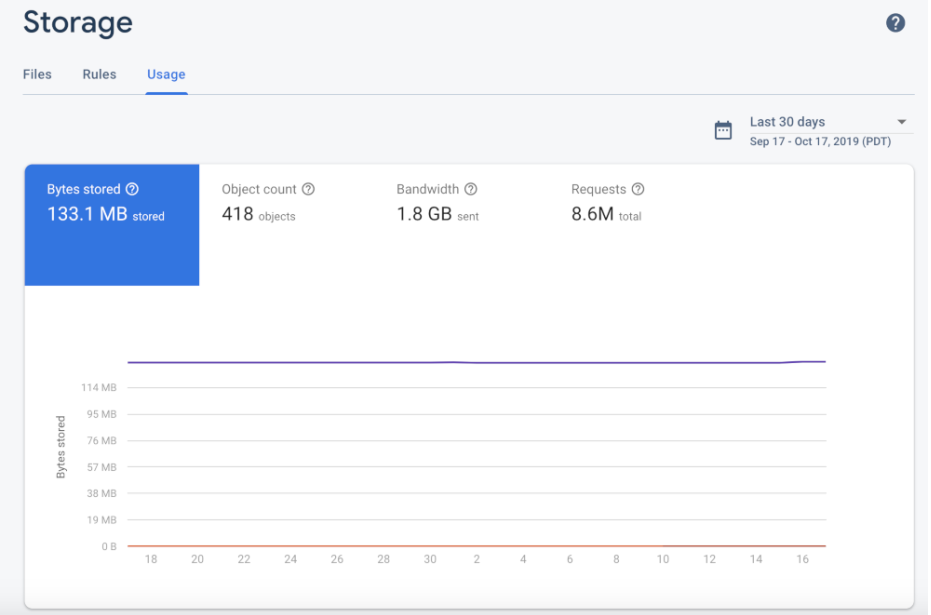
تتضمّن وحدة تحكّم Firebase لوحة بيانات الاستخدام التي تعرض وحدات بايت التخزين المخزّنة وعدد العناصر وعرض النطاق الترددي وطلبات التنزيل بمرور الوقت. يتم تعديل مقاييس مساحة التخزين (عدد البايتات المخزَّنة وعدد العناصر) في غضون 24 ساعة. يتم تعديل مقاييس الاستخدام (معدل نقل البيانات وطلبات التنزيل) كل بضع ساعات.
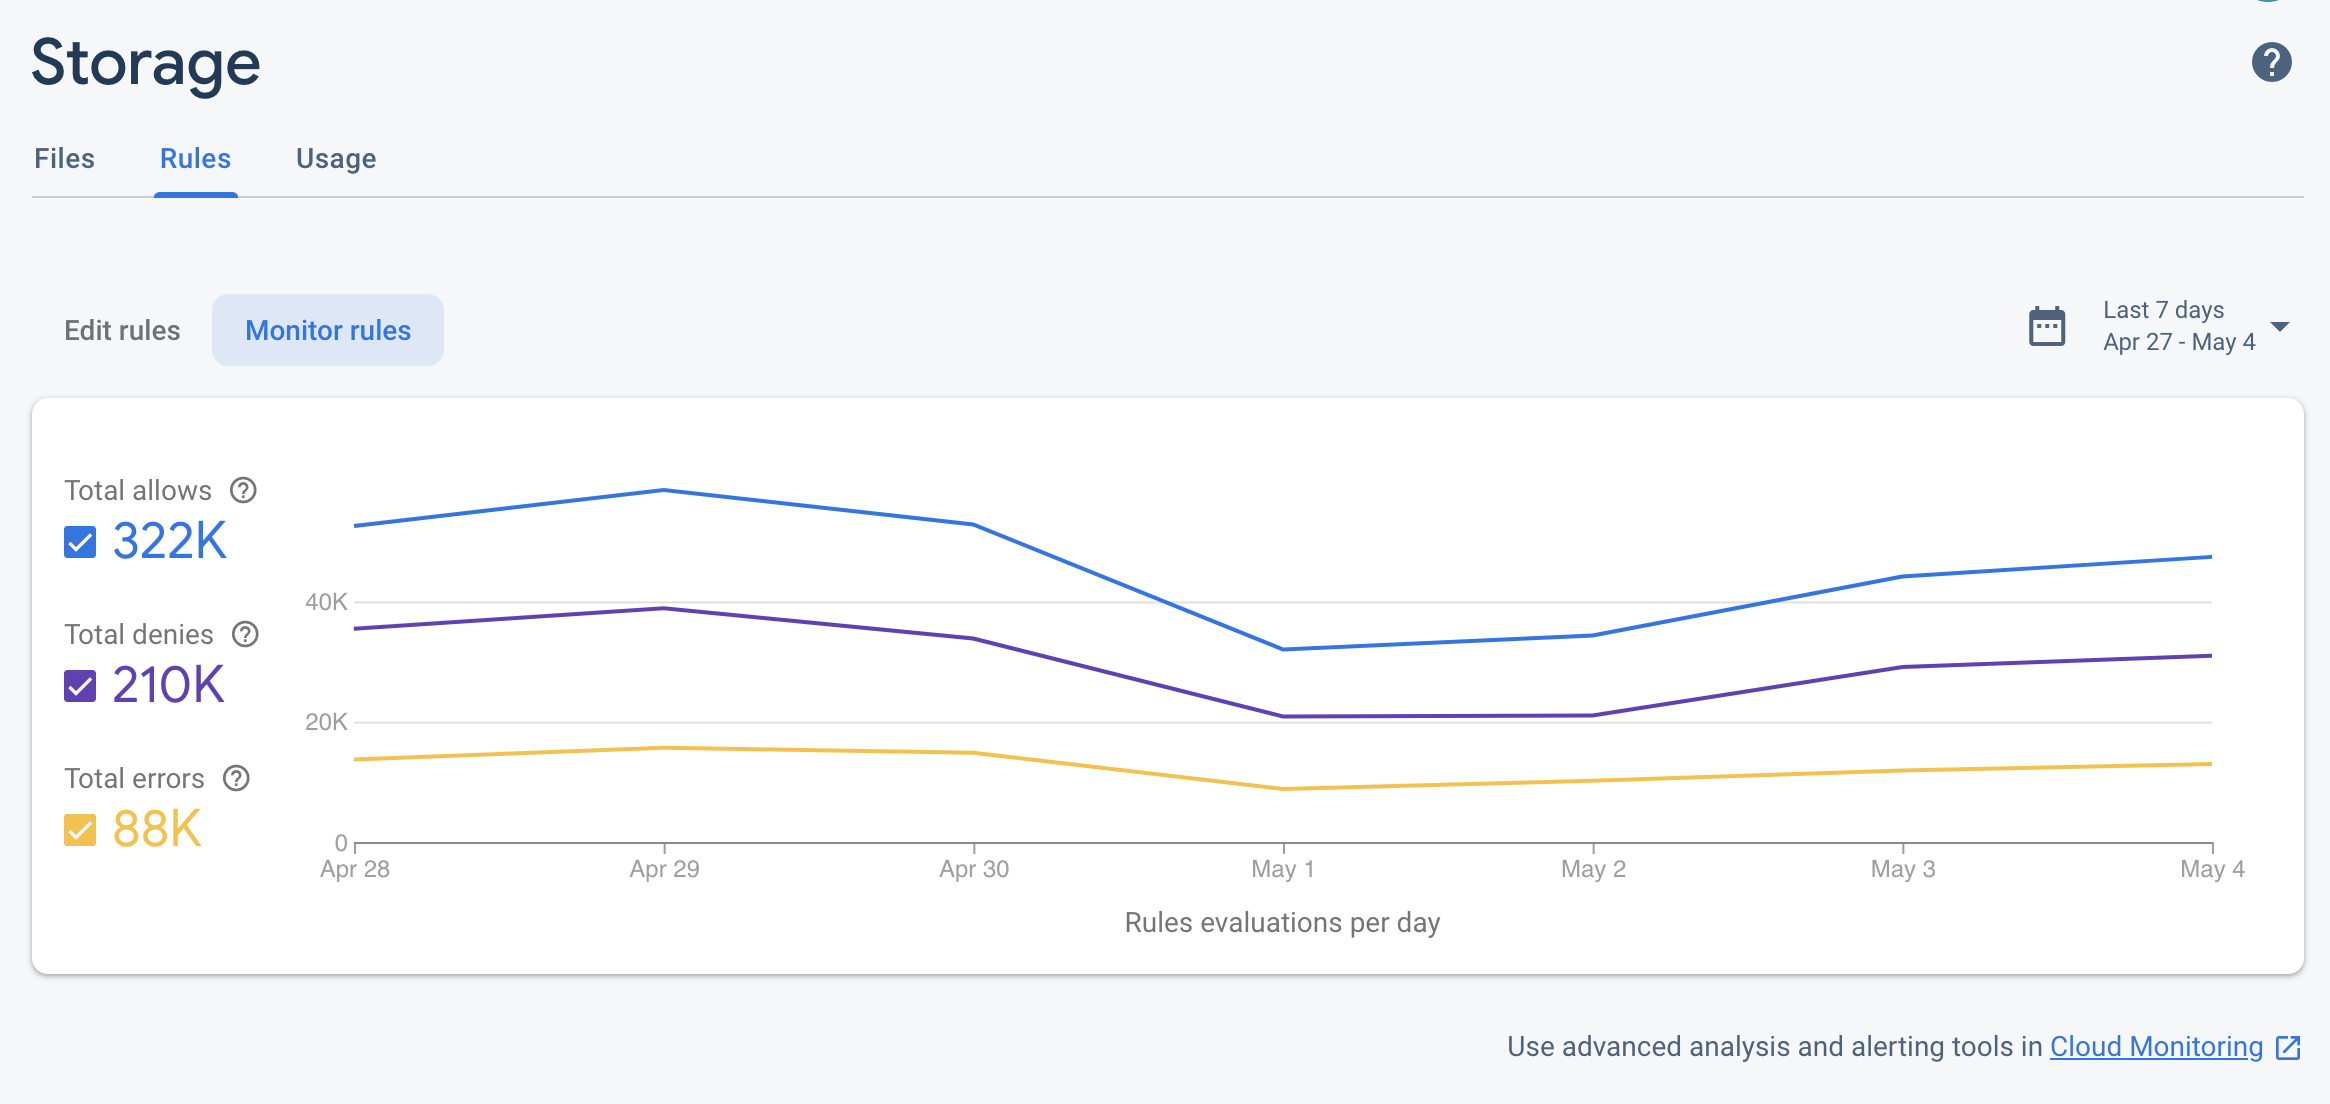
بالإضافة إلى ذلك، توفّر وحدة تحكّم Firebase لوحة بيانات تقييم Firebase Security Rules، وهي عرض مفيد وسريع لعمليات استدعاء القواعد. يمكنك أيضًا مراقبة استخدام Firebase Security Rules من خلال Cloud Monitoring. ويوفّر ذلك مقاييس تقييم القواعد نفسها، بالإضافة إلى إمكانية إنشاء لوحات بيانات مخصّصة وتحليل المؤشرات وإعداد التنبيهات (على سبيل المثال، عند ارتفاع عدد الطلبات المرفوضة). راجِع مرجع مقاييس Cloud Monitoring للاطّلاع على القائمة الكاملة بالمقاييس المتاحة.
Google Cloud وحدة التحكّم
بما أنّ مشروع Firebase هو مجرد مشروع Google Cloud تمّت إضافة خدمات وإعدادات Firebase إليه، يمكنك الاطّلاع على مشروعك في وحدة تحكّم Google Cloud.
إذا كان لديك حزمة Cloud Storage تلقائية بتنسيق الاسم *.appspot.com
Cloud Monitoring
تجمع خدمة Cloud Monitoring المقاييس والأحداث والبيانات الوصفية من منتجات Google Cloud التي يمكنك استخدامها لإنشاء لوحات بيانات ورسوم بيانية وتنبيهات. يتضمّن Cloud Monitoring مقاييس Cloud Storage التالية ذات الصلة بقواعد الأمان:
| اسم المقياس | الوصف |
|---|---|
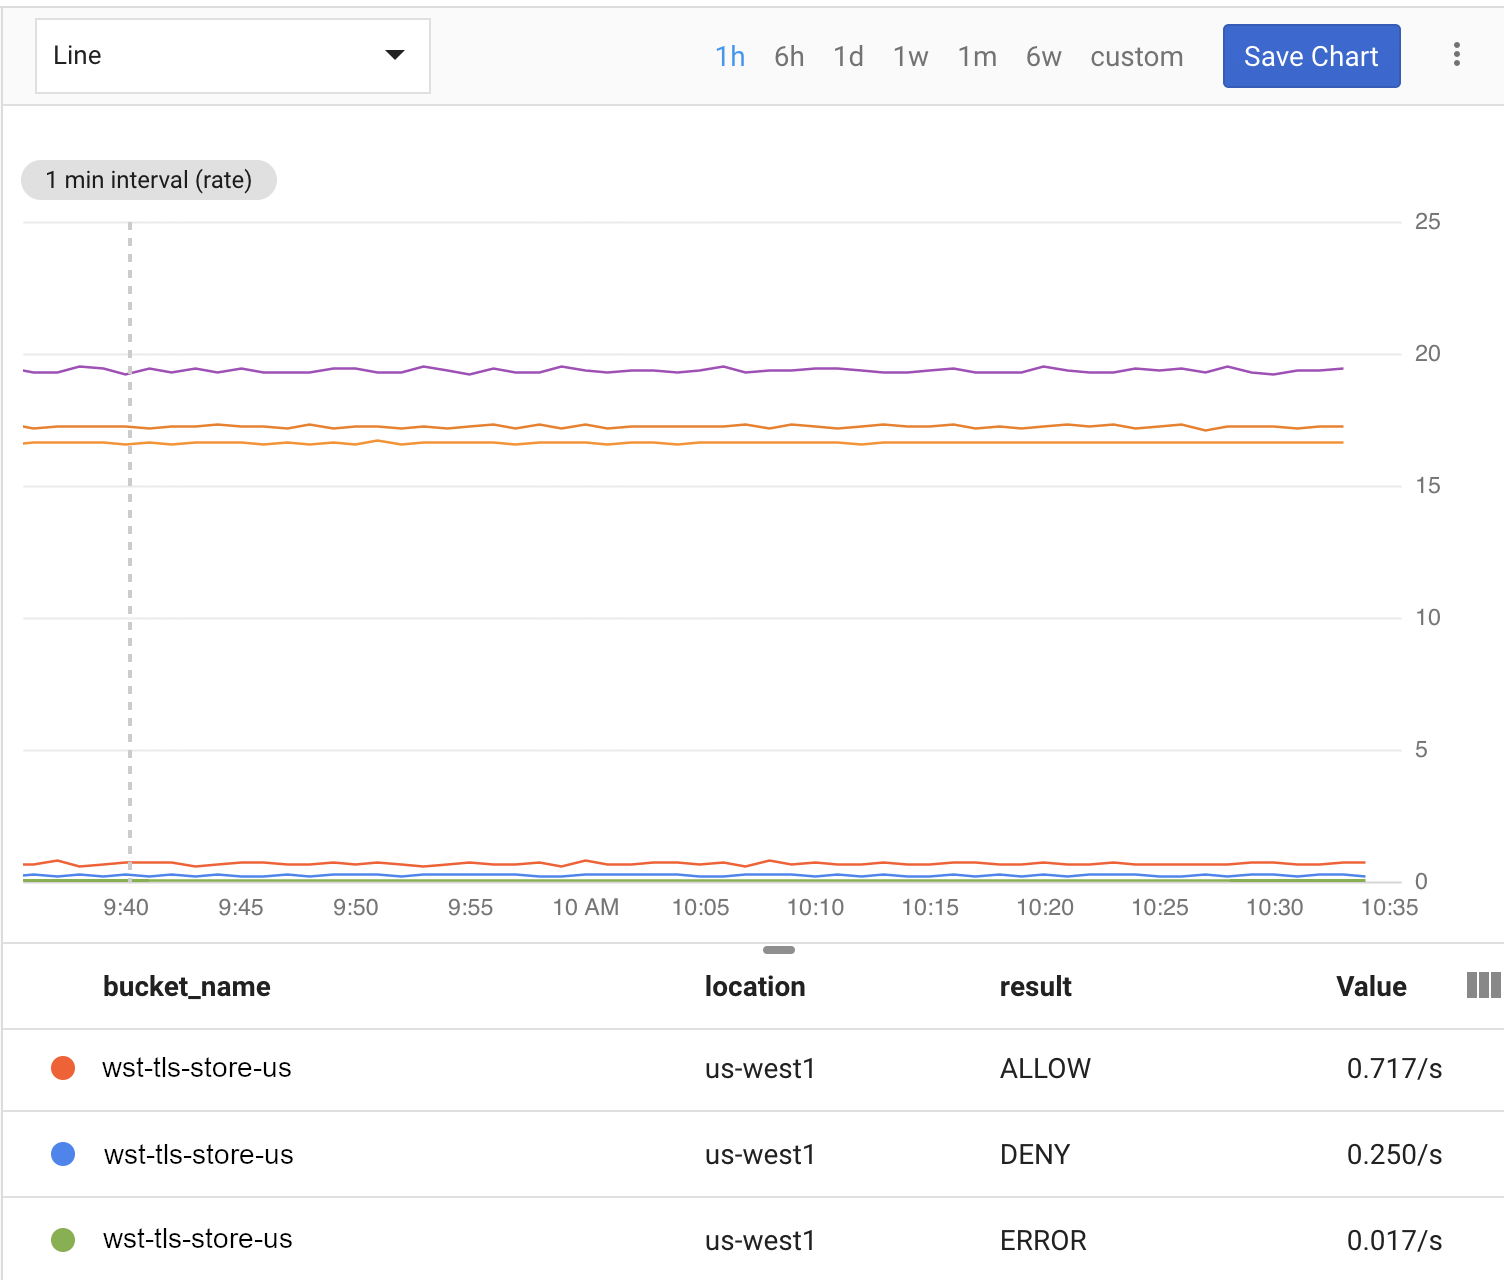
| تقييمات القواعد | عدد عمليات التقييم التي تم إجراؤها استجابةً لطلبات الكتابة أو القراءةCloud Storage Security Rules يمكنك تقسيم هذا المقياس حسب نتيجة الطلب (ALLOW أو DENY أو ERROR) أو اسم المجموعة. |
- معدّل أخذ العيّنات
- يتم أخذ عيّنات من مقاييس Cloud Storage كل 60 ثانية، ولكن قد يستغرق ظهور التعديلات في لوحات البيانات مدة تصل إلى 4 دقائق.
باستخدام هذه المقاييس، يمكنك إعداد لوحة بيانات Cloud Storage على النحو التالي:
أكمِل الخطوات أدناه لبدء رصد Cloud Storage باستخدام Cloud Monitoring.
إنشاء مساحة عمل في Cloud Monitoring
لمراقبة Firebase باستخدام Cloud Monitoring، يجب إعداد مساحة عمل لمشروعك. تنظّم مساحة العمل معلومات المراقبة من مشروع واحد أو أكثر. بعد إعداد مساحة عمل، يمكنك إنشاء لوحات بيانات مخصّصة وسياسات تنبيه.
-
إذا كان مشروعك جزءًا من مساحة عمل، سيتم فتح صفحة Cloud Monitoring. في الحالات الأخرى، اختَر مساحة عمل لمشروعك.
اختَر الخيار مساحة عمل جديدة أو اختَر مساحة عمل حالية.
انقر على إضافة. بعد إنشاء مساحة العمل، يتم فتح صفحة Cloud Monitoring.
إنشاء لوحة بيانات وإضافة رسم بياني
عرض مقاييس Firebase التي تم جمعها من Cloud Monitoring في الرسوم البيانية ولوحات البيانات الخاصة بك
قبل المتابعة، تأكَّد من أنّ مشروعك يندرج ضمن مساحة عمل Cloud Monitoring.
في صفحة Cloud Monitoring، افتح مساحة العمل وانتقِل إلى صفحة لوحات البيانات.
انقر على إنشاء لوحة بيانات وأدخِل اسمًا للوحة البيانات.
في أعلى يسار الصفحة، انقر على إضافة رسم بياني.
في نافذة إضافة رسم بياني، أدخِل عنوان الرسم البياني. انقر على علامة التبويب المقياس.
في حقل البحث عن نوع المورد والمقياس، أدخِل مساحة تخزين سحابية لـ Firebase. من القائمة المنسدلة التي تتم تعبئتها تلقائيًا، اختَر أحد مقاييس Cloud Storage.
لإضافة المزيد من المقاييس إلى الرسم البياني نفسه، انقر على إضافة مقياس وكرِّر الخطوة السابقة.
يمكنك تخصيص الرسم البياني حسب الحاجة. على سبيل المثال، في الحقل فلتر، انقر على + إضافة فلتر. انتقِل للأسفل، ثمّ اختَر قيمة أو نطاقًا للمقياس الذي يهمّك والذي تريد فلترة الرسم البياني استنادًا إليه.
انقر على حفظ.
لمزيد من المعلومات عن رسومات Cloud Monitoring البيانية، راجِع العمل باستخدام الرسوم البيانية.
إنشاء سياسة تنبيه
يمكنك إنشاء سياسة تنبيه استنادًا إلى مقاييس Firebase. يمكنك اتّباع الخطوات التالية لإنشاء سياسة تنبيه تُرسل إليك رسالة إلكترونية عندما يستوفي مقياس Firebase معيّن حدًا معيّنًا.
قبل المتابعة، تأكَّد من أنّ مشروعك يندرج ضمن مساحة عمل Cloud Monitoring.
في صفحة Cloud Monitoring، افتح مساحة العمل وانتقِل إلى صفحة التنبيهات.
انقر على إنشاء سياسة.
أدخِل اسمًا لسياسة التنبيه.
أضِف شرط تنبيه استنادًا إلى أحد مقاييس Firebase. انقر على إضافة شرط.
اختَر هدفًا. في حقل البحث عن نوع المورد والمقياس، أدخِل مساحة تخزين سحابية لـ Firebase. من القائمة المنسدلة التي تتم تعبئتها تلقائيًا، اختَر أحد مقاييس Cloud Storage.
ضمن مشغّلات السياسة، استخدِم الحقول المنسدلة لتحديد شرط التنبيه.
أضِف قناة إشعارات إلى سياسة التنبيه. ضمن الإشعارات، انقر على إضافة قناة إشعارات. اختَر البريد الإلكتروني من القائمة المنسدلة.
أدخِل عنوان بريدك الإلكتروني في حقل عنوان البريد الإلكتروني. انقر على إضافة.
يمكنك ملء حقل المستندات لتضمين معلومات إضافية في الإشعار الذي يتم إرساله عبر البريد الإلكتروني.
انقر على حفظ.
إذا تجاوز استخدامك Cloud Storage الحدّ الذي تم ضبطه، ستتلقّى تنبيهًا عبر البريد الإلكتروني.
لمزيد من المعلومات حول سياسات التنبيه، راجِع مقدمة عن التنبيه.