
This page describes how to use the Query insights dashboard to detect and analyze query performance.
Query insights overview
Use the Query insights dashboard to monitor metrics-related queries. Based on the metrics, you can identify the most frequently used queries and queries with high latencies that might require optimization. Use the Query insights dashboard to help you with:
- Query performance optimization: identify queries with high latencies and that might need optimization.
- Query cost management: discover high-cost queries and optimize them to reduce costs.
- Query stats monitoring: track query stats over time.
- Index recommendations: identify missing or suboptimal composite indexes and create recommended indexes directly from the dashboard (Enterprise edition).
Query insights data
Query insights includes data from the following API methods:
findaggregate
You can view data about the queries that use these methods for a given project, database, and time duration ranging from 10 minutes to 30 days. Data for queries with equivalent structures is captured under a single normalized query.
Query insights returns the following information about a query:
| Normalized query text | The query structure represented in text. |
| Execution count | Number of executions in the selected time window. |
| Error count | Number of errors in the selected time window. |
| Average execution duration(ms) | The average time in milliseconds it took the database to process the query. |
| Average number of results returned | The number of results returned by the query. Results include documents, collection IDs, and aggregated buckets. |
| Average number of documents scanned | The number of documents scanned in a query. |
| Average number of index entries scanned | The number of index entries examined to execute the query. |
| Load by average time | Data to help filter for the top queries based on average latency. |
| Load by total (billable) read operations | Data to help filter for the top queries based on total billable read operations. |
| Index recommendations | Recommended composite indexes, used indexes, and estimated workload impact for queries in Enterprise edition databases. |
Data granularity and retention
Data granularity depends on the duration specified:
- 10 minute granularity for intervals up to 4 days ago
- 1 hour granularity for intervals up to 30 days ago
The maximum data retention for Query insights is 30 days. 10-minute data is stored for 4 days, and hourly data is stored for 30 days.
View Query insights
Firebase console
- To view query insights for a Cloud Firestore database, open the database Query insights pane in the Google Cloud console.
In the Firebase console, go to the Firestore Database page.
- From the list of databases, select a database.
- From the list of tabs, click Query Insights.
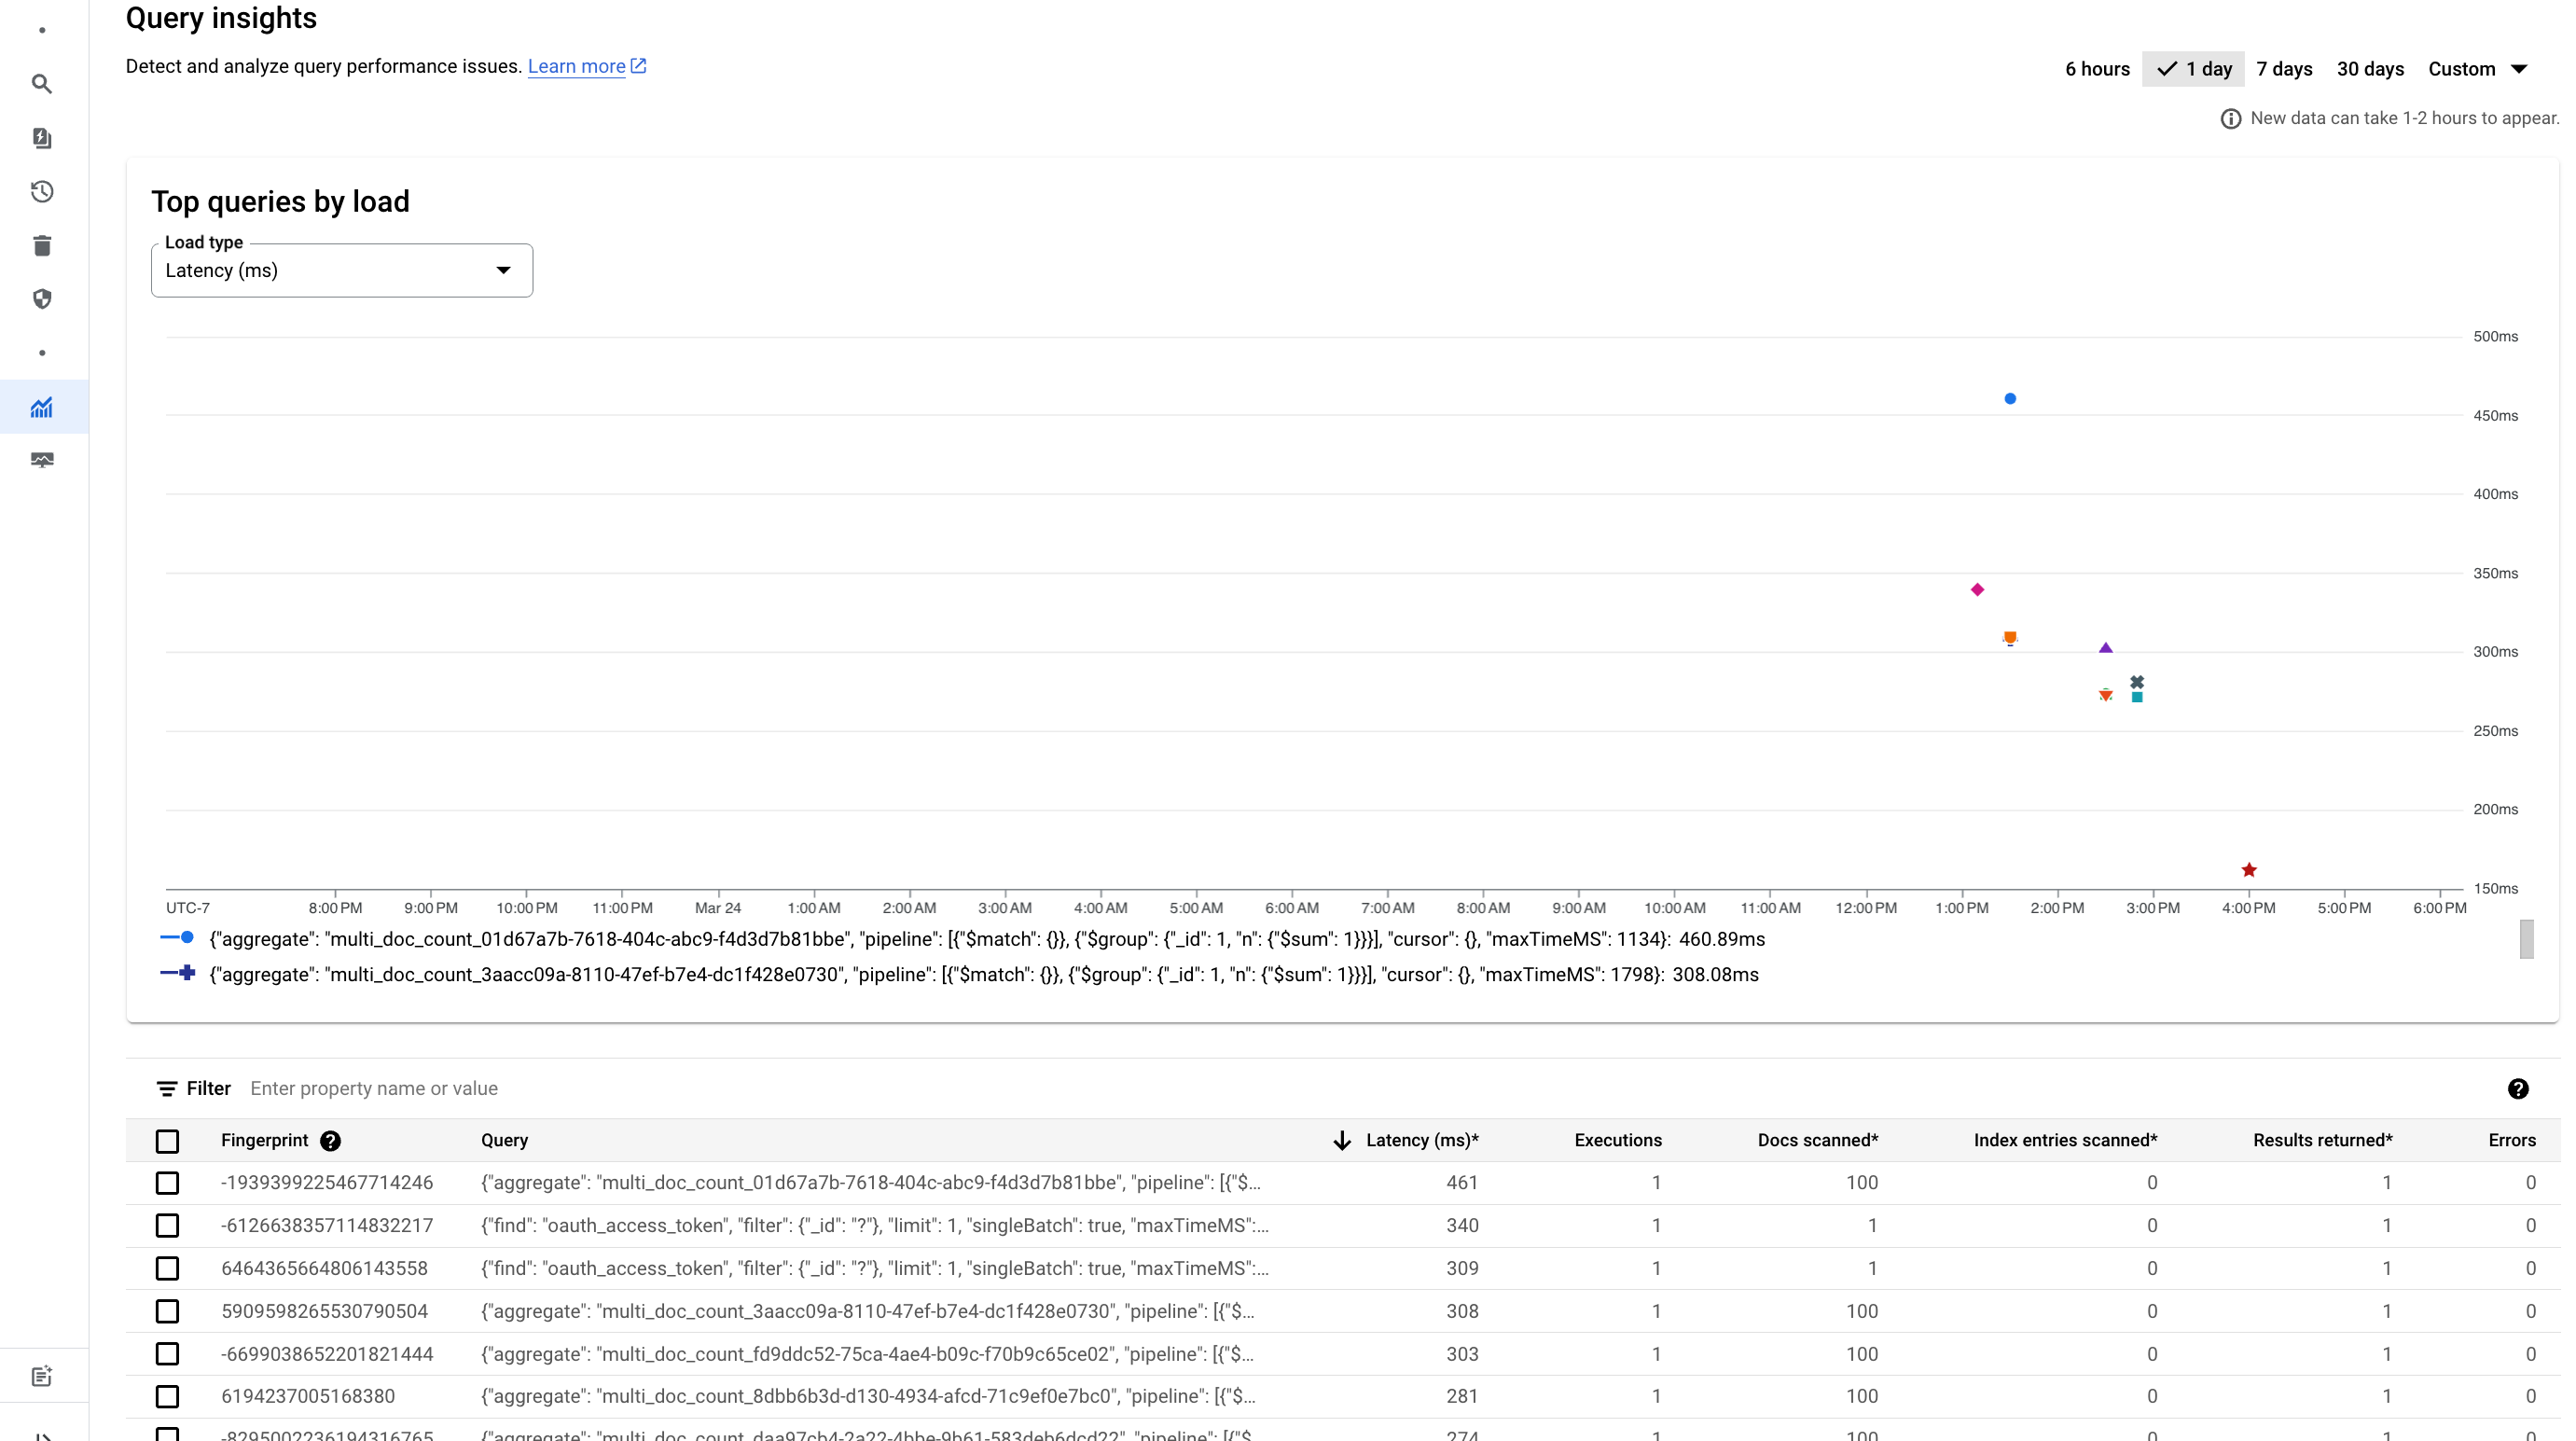
To find top queries based on either latency or number of read operations, click Latency or Read operations.
Index recommendations
Index recommendations for Query insights automatically identify missing or suboptimal composite index configurations for frequently executed query shapes in Firestore Enterprise edition databases.
In Firestore Enterprise edition, queries can run even without matching composite indexes, which can result in slow full collection scans or in-memory sort operations. The Query insights dashboard analyzes historical query execution statistics and suggests targeted composite indexes to optimize query latency and reduce billable scanned documents.
How index recommendations work
An offline batch pipeline periodically evaluates historical top queries:
- Query structure analysis: Extracts equality, sort, and range predicates from frequently executed queries.
- Candidate index generation: Generates prospective composite index definitions using index-ordering heuristics (Equality > Sort > Range).
- Optimizer evaluation: Injects candidate indexes into the query engine's cost model to compare baseline query execution costs against hypothetical indexed execution plans.
- Workload impact ranking: Ranks recommended indexes into impact tiers
based on total estimated workload cost savings:
- HIGH: Converts full collection scans to selective index seeks, significantly reducing document reads and execution latency.
- MEDIUM: Eliminates expensive operations such as in-memory sorting by providing pre-sorted index results.
- LOW: Offers minor seek improvements.
View and create recommended indexes
To view index recommendations and create suggested indexes from the Firebase console:In the Firebase console, go to the Firestore Database page.
From the list of databases, select an Enterprise edition database.
Click the Query Insights tab.
In the queries table, locate a query shape with recommendations and click Review Recommendations in the row or popover.
In the index recommendation dialog, review the composite index definition, field ordering, and estimated workload impact tier (HIGH, MEDIUM, or LOW).
Click Save. The Long-Running Operations (LRO) drawer opens to track the index build progress.
Once the build completes, the index is listed under the Indexes tab, and the recommendation indicator disappears from the query row.
Supported editions
Index recommendations are supported only for Firestore Enterprise edition databases. Standard edition databases aren't supported.
Limitations
- Query insights data is delayed by one to two hours.
- Index recommendations are generated periodically based on historical query data, not in real time.
- Index recommendations suggest new composite indexes; they don't suggest modifying or deleting existing indexes.
- Automatic index creation isn't supported; recommended indexes must be created manually.
- Query normalization replaces literal values with placeholders. Index recommendations are based on normalized query templates rather than specific runtime values.
- Cost evaluation uses heuristics rather than live data sampling. Recommended indexes might not improve performance in every scenario, and creating an index adds write and storage overhead.
Pricing
There's no additional cost for Query insights or index recommendations.
Required roles
To get the permissions that you need to view the Query insights dashboard and create recommended indexes, ask your administrator to grant you the following IAM roles on your project:
- To view Query insights:
Datastore Viewer
(
roles/datastore.viewer) - To create recommended indexes:
Datastore Index Admin
(
roles/datastore.indexAdmin) or Cloud Datastore Owner (roles/datastore.owner)
These predefined roles contain the datastore.insights.get and
datastore.indexes.create permissions.
You might also be able to get these permissions with custom roles or other predefined roles.