

หน้านี้อธิบายวิธีดึงข้อมูลการดำเนินการค้นหาเมื่อคุณดำเนินการค้นหา
ใช้คำอธิบายการค้นหา
คุณสามารถใช้คำอธิบายการค้นหาเพื่อทำความเข้าใจวิธีดำเนินการกับการค้นหา ซึ่งจะให้รายละเอียดที่คุณใช้เพิ่มประสิทธิภาพการค้นหาได้
คุณสามารถใช้คำอธิบายการค้นหาผ่านคอนโซล Google Cloud หรือคำสั่ง explain ได้
คอนโซล
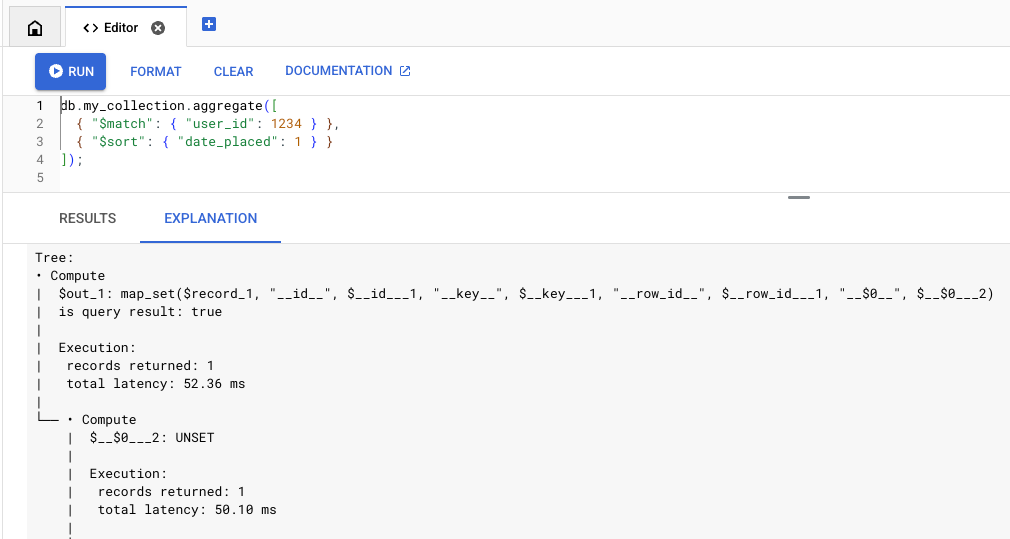
เรียกใช้คำค้นหาในตัวแก้ไขคำค้นหา แล้วเปิดแท็บคำอธิบาย
-
ในคอนโซล Google Cloud ให้ไปที่หน้าฐานข้อมูล
- เลือกฐานข้อมูล Cloud Firestore จากรายการฐานข้อมูล Google Cloud Console จะเปิด Firestore Explorer สำหรับฐานข้อมูลนั้น
- ป้อนคำค้นหาในตัวแก้ไขคำค้นหา แล้วคลิกเรียกใช้
-
คลิกแท็บคำอธิบายเพื่อดูเอาต์พุตการวิเคราะห์การค้นหา
MongoDB API
ระบบรองรับการค้นหา Explain ใน MongoDB API ผ่านคำสั่ง
explain
ซึ่งคุณใช้ได้ในเครื่องมือต่างๆ เช่น Mongo Shell และ Compass
คำสั่ง explain ใช้ได้กับคำสั่ง aggregate
find, distinct และ count
เช่น
db.collection.explain('executionStats').find(...)
คุณยังใช้วิธี explain() ได้ด้วย เช่น
db.collection.find({QUERY}).explain('executionStats')ข้อจำกัด
โปรดทราบข้อจำกัดและความแตกต่างต่อไปนี้-
Query Explain ไม่รองรับคำสั่งที่แสดงผลเคอร์เซอร์ ตัวอย่างเช่น ระบบไม่รองรับการเรียกใช้คำสั่งอธิบายโดยการเรียกใช้คำสั่งต่อไปนี้โดยตรง
db.collection.aggregate(..., explain: true)
คำอธิบายการค้นหาใช้ได้กับคำสั่ง
find,aggregate,count,distinct,update,deleteและfindAndModifyเท่านั้น-
Query Explain รองรับโหมด Verbosity
executionStats,allPlansExecutionและqueryPlannerqueryPlanner: แสดงเฉพาะแผนการดำเนินการโดยไม่ต้องดำเนินการค้นหาexecutionStatsและallPlansExecution: แสดงแผนการดำเนินการพร้อมกับการเรียกเก็บเงิน หน่วยความจำ และสถิติการดำเนินการ
หากไม่ได้ระบุโหมด Verbosity ไว้ เชลล์จะใช้ค่าเริ่มต้นเป็น
queryPlannerหากต้องการดูสถิติการดำเนินการทั้งหมด คุณต้องระบุโหมดexecutionStatsหรือallPlansExecution
การวิเคราะห์
เอาต์พุตของ Query Explain มีองค์ประกอบหลัก 2 อย่าง ได้แก่ สถิติสรุป และแผนผังการดำเนินการ ลองดูตัวอย่างคำค้นหานี้
db.orders.aggregate(
 [
   { "$match": { "user_id": 1234 } },
   { "$sort": { "date_placed": 1 } }
 ]
)
สถิติสรุป
ส่วนบนของเอาต์พุตที่อธิบายจะมีสรุปสถิติการดำเนินการ ใช้สถิติเหล่านี้เพื่อพิจารณาว่าการค้นหามีเวลาในการตอบสนองหรือต้นทุนสูงหรือไม่ นอกจากนี้ ยังมีสถิติหน่วยความจำที่ช่วยให้คุณทราบว่าคําค้นหาของคุณใกล้ถึงขีดจํากัดหน่วยความจำมากน้อยเพียงใด
Execution:
 results returned: 35
 query id: 7e7b37ea1a259d79
 request peak memory usage: 45.56 KiB (46,656 B)
 data bytes read: 24.58 KiB (25,175 B)
 entity row scanned: 265

Billing:
 read units: 7
แผนผังการดำเนินการ
แผนผังการดำเนินการจะอธิบายการดำเนินการค้นหาเป็นชุดของโหนด โหนดด้านล่าง (โหนดใบ) จะดึงข้อมูลจากเลเยอร์พื้นที่เก็บข้อมูลซึ่งจะเคลื่อนที่ขึ้นไปตามโครงสร้างต้นไม้เพื่อสร้างการตอบกลับการค้นหา
ดูรายละเอียดเกี่ยวกับโหนดการดำเนินการแต่ละรายการได้ที่ข้อมูลอ้างอิงเกี่ยวกับการดำเนินการ
ดูรายละเอียดเกี่ยวกับวิธีใช้ข้อมูลนี้เพื่อเพิ่มประสิทธิภาพการค้นหาได้ที่เพิ่มประสิทธิภาพการดำเนินการค้นหา
ตัวอย่างแผนผังการดำเนินการมีดังนี้
Execution:
 results returned: 35
 query id: 7e7b37ea1a259d79
 request peak memory usage: 45.56 KiB (46,656 B)
 data bytes read: 24.58 KiB (25,175 B)
 entity row scanned: 265

Billing:
 read units: 7

Tree:
• Compute
|  $out_1: map_set($record_1, "__id__", $__id___1, "__key__", unset)
|  is query result: true
|
|  Execution:
|   records returned: 35
|   latency: 204.87 ms (local 7.64 ms)
|
└── • Compute
    |  $__id___1: _id($__key___2)
    |
    |  Execution:
    |   records returned: 35
    |   latency: 197.23 ms (local 2.04 ms)
    |
    └── • MajorSort
        |  fields: [$v_5 ASC]
        |  output: [$__key___2, $record_1]
        |
        |  Execution:
        |   records returned: 35
        |   latency: 195.20 ms (local 28.42 ms)
        |   peak memory usage: 45.56 KiB (46,656 B)
        |
        └── • Compute
            |  $v_5: offset($v_4, 0L)
            |
            |  Execution:
            |   records returned: 35
            |   latency: 166.78 ms (local 14.84 ms)
            |
            └── • Compute
                |  $v_4: sortPaths(array($date_placed_1), [date_placed ASC])
                |
                |  Execution:
                |   records returned: 35
                |   latency: 151.94 ms (local 5.43 ms)
                |
                └── • TableScan
                       source: **/orders
                       order: STABLE
                       filter: $eq($user_id_1, 1,234)
                       output bindings: {$__key___2=row().__key__, $date_placed_1=row().date_placed, $record_1=row[* - { __create_time__, __update_time__ }](), $user_id_1=row().user_id}
                       output: [$__key___2, $date_placed_1, $record_1]

                       Execution:
                        records returned: 35
                        latency: 146.50 ms
                        data bytes returned: 3.25 KiB (3,325 B)
                        post-filtered rows: 230
                        records scanned: 265
                        data bytes read: 24.58 KiB (25,175 B)
ขั้นตอนถัดไป
- ดูข้อมูลเกี่ยวกับโหนดแผนการดำเนินการได้ที่ข้อมูลอ้างอิงการดำเนินการของคําค้นหา
- ดูวิธีเพิ่มประสิทธิภาพการค้นหาได้ที่เพิ่มประสิทธิภาพการดำเนินการค้นหา